- Home >
- Stock Photos >
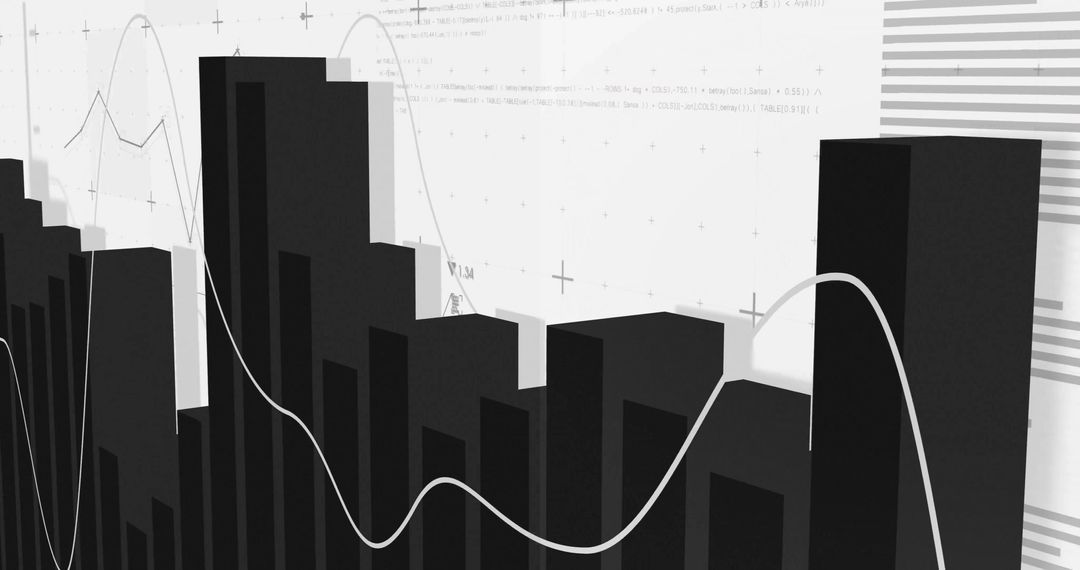
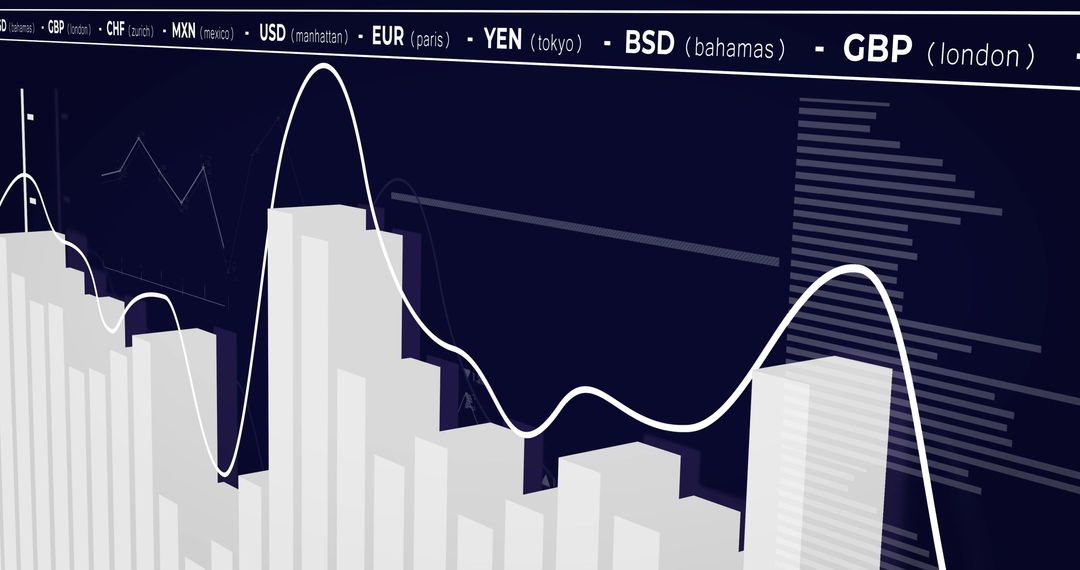
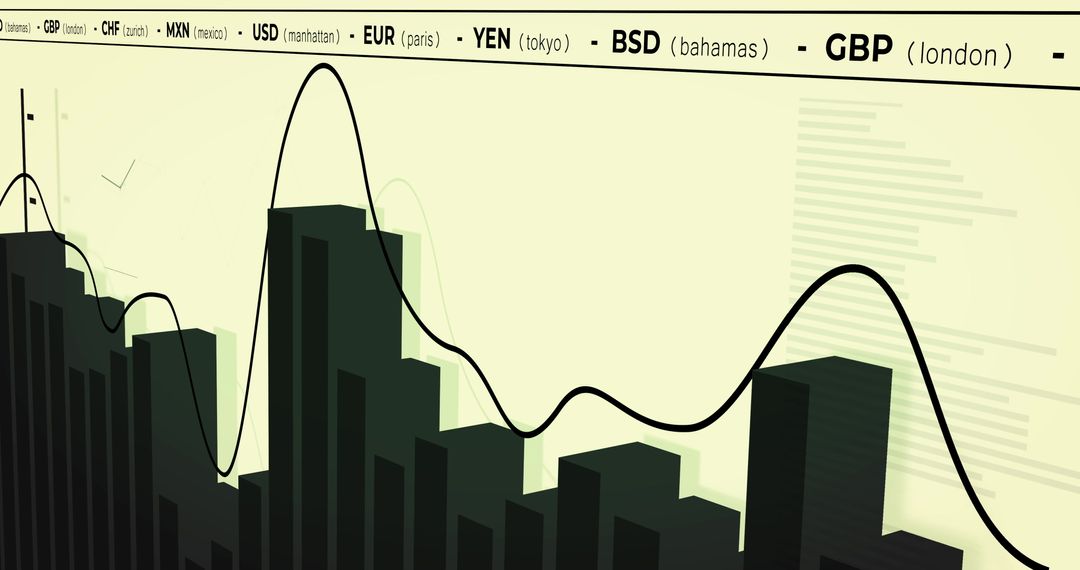
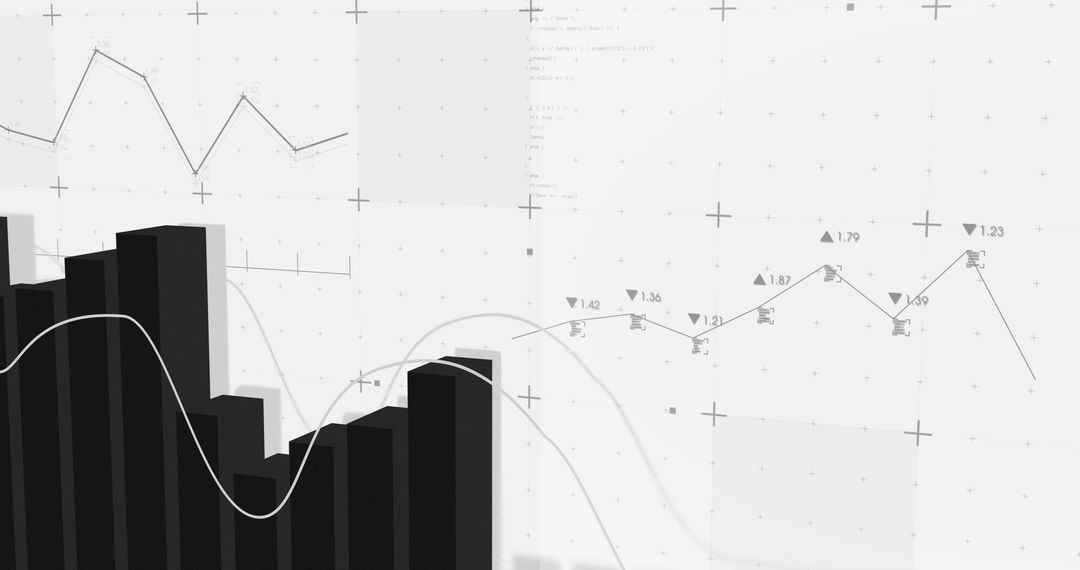
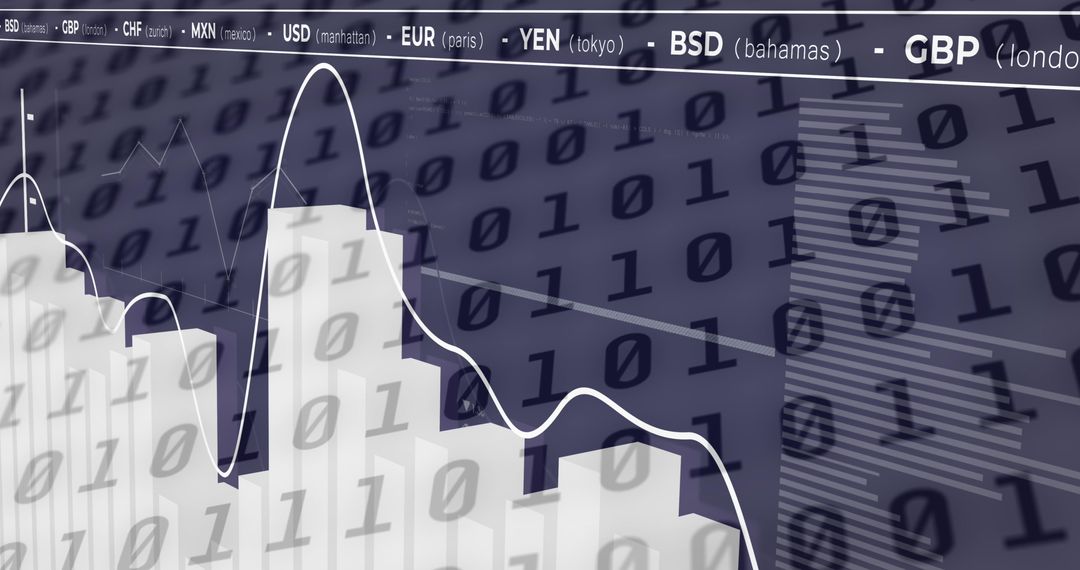
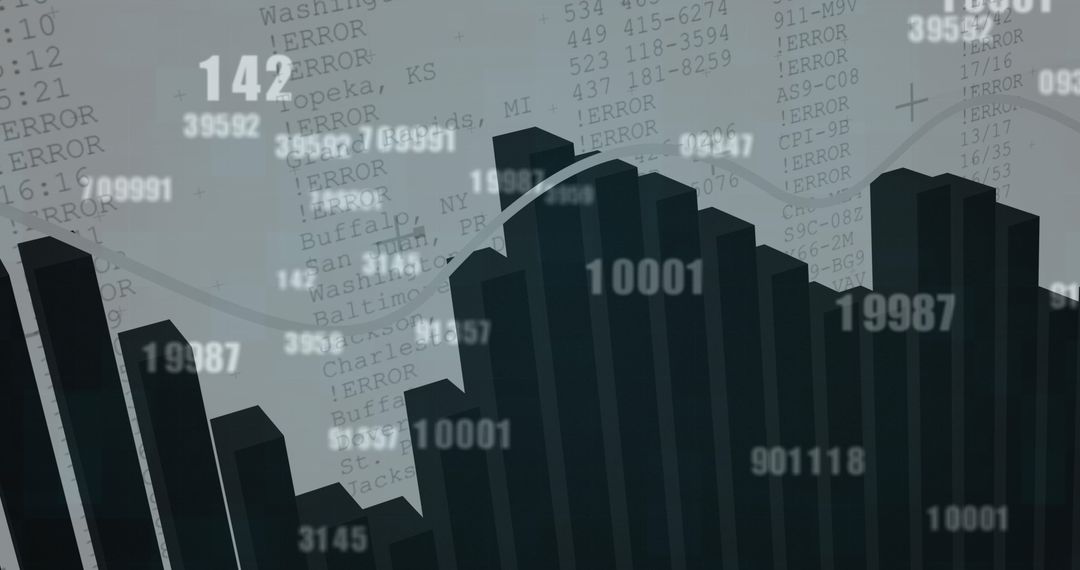
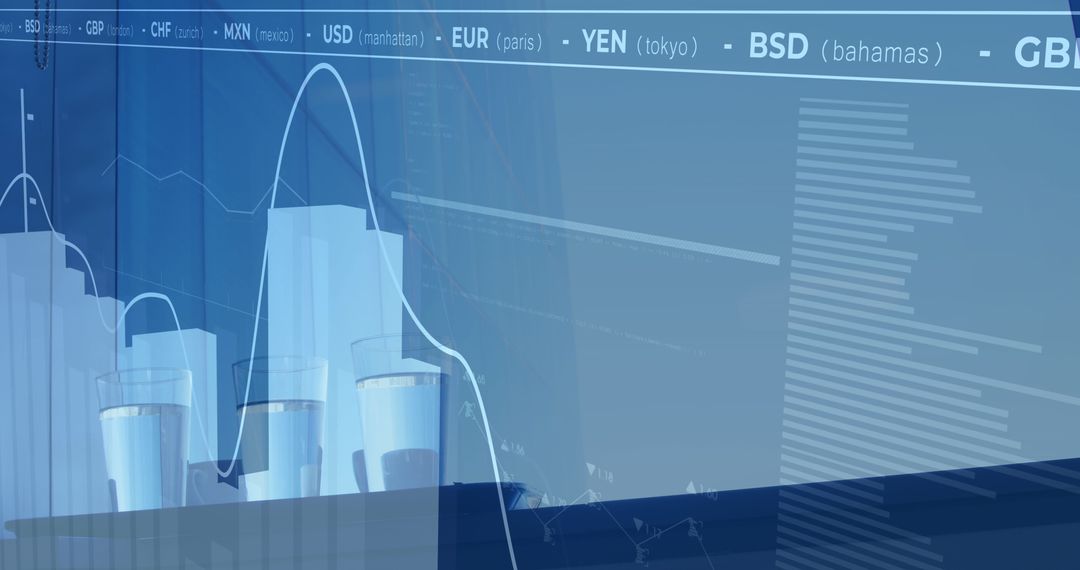
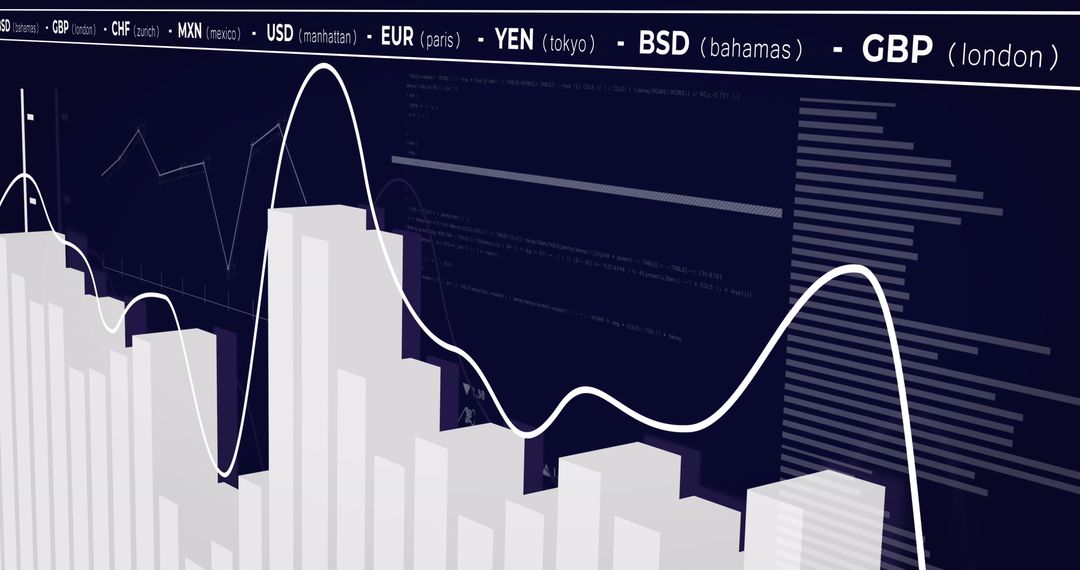
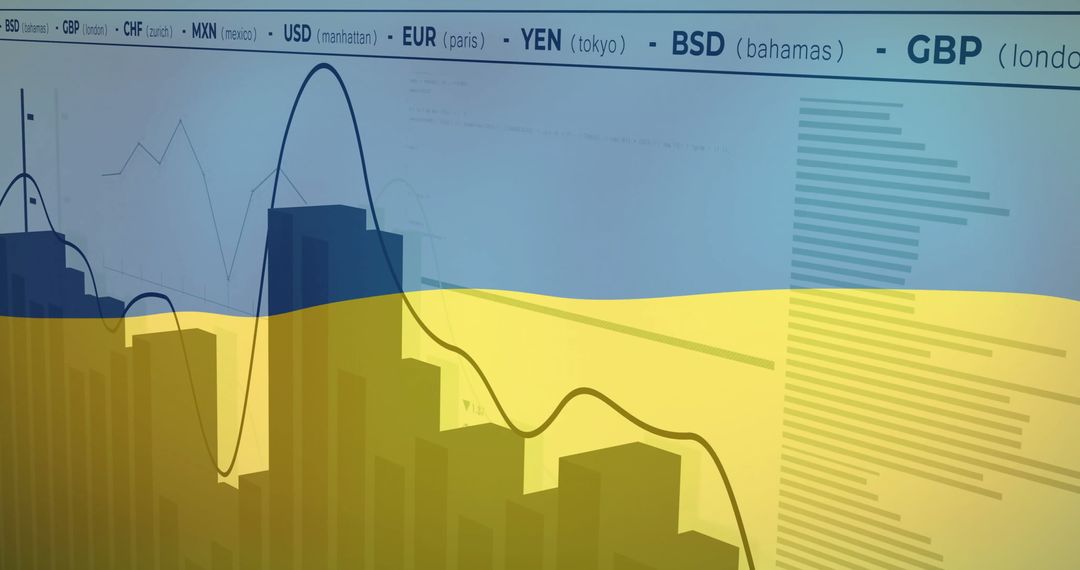
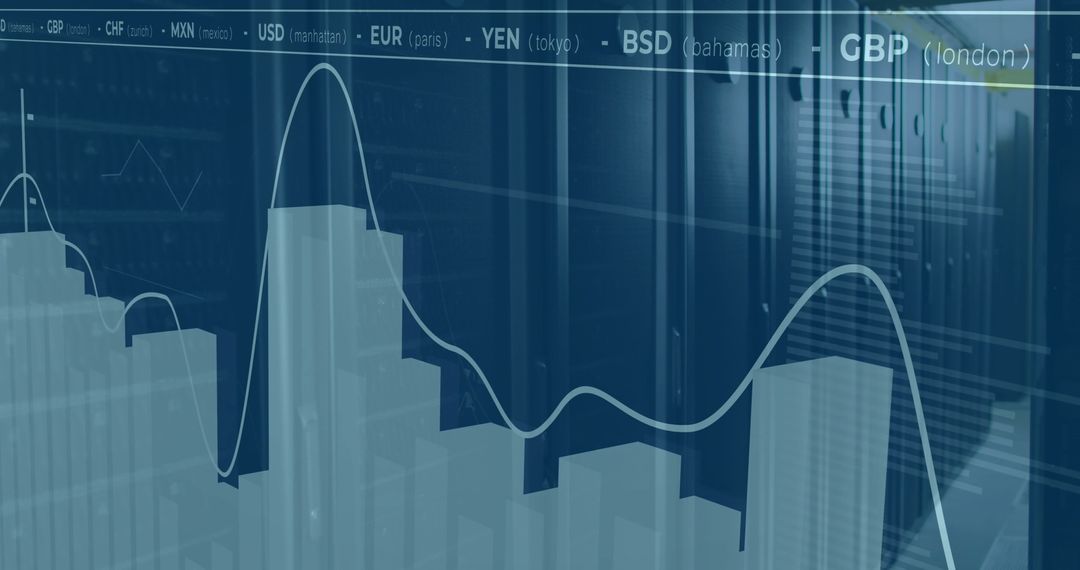
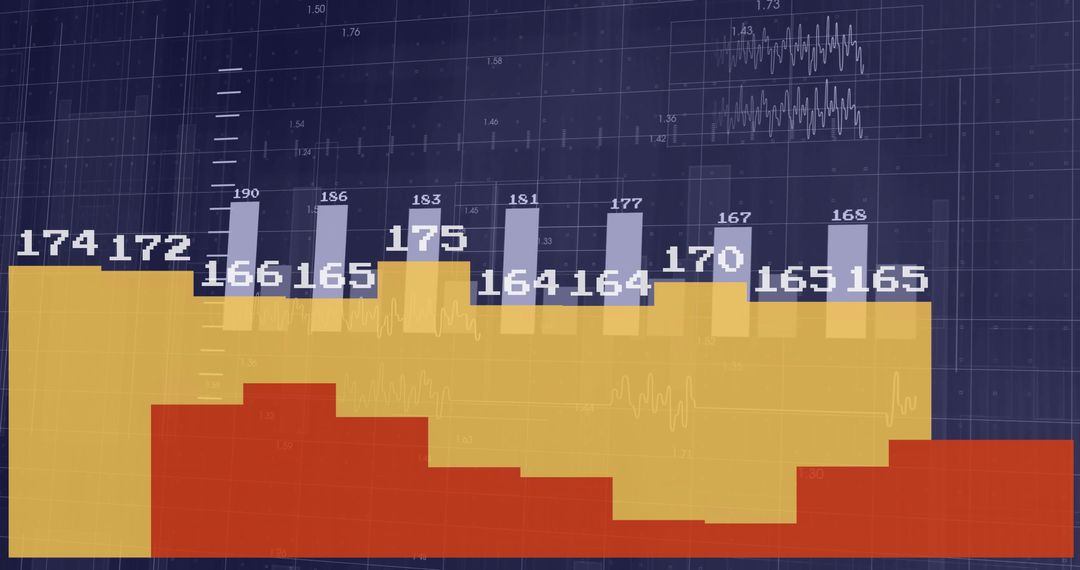
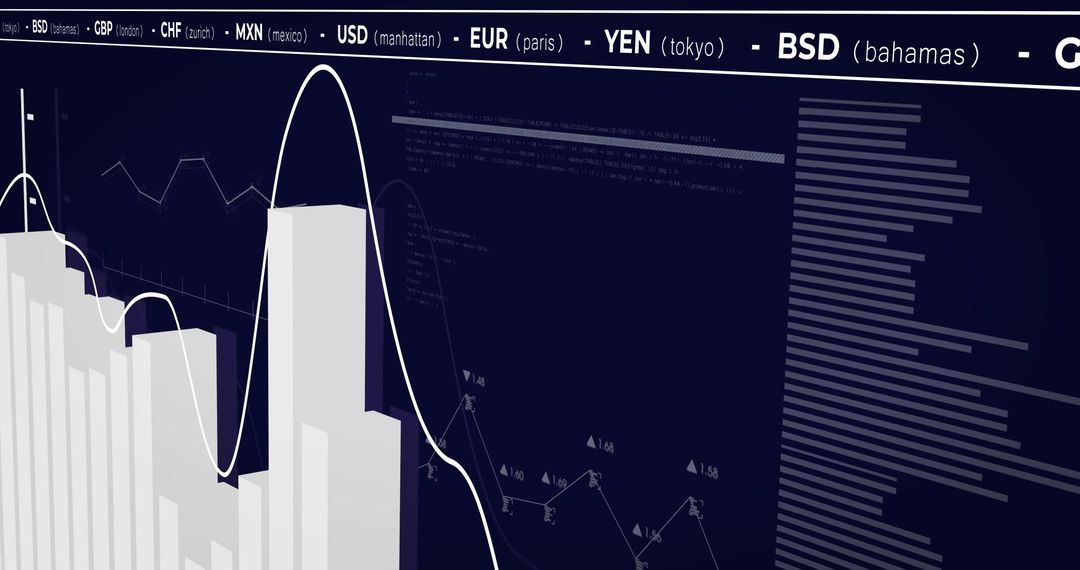
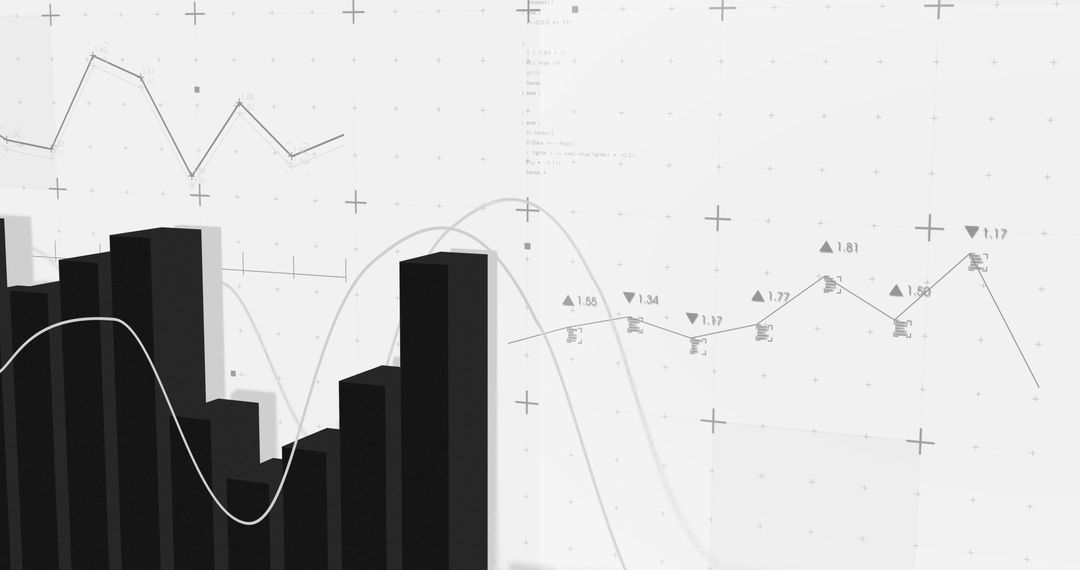
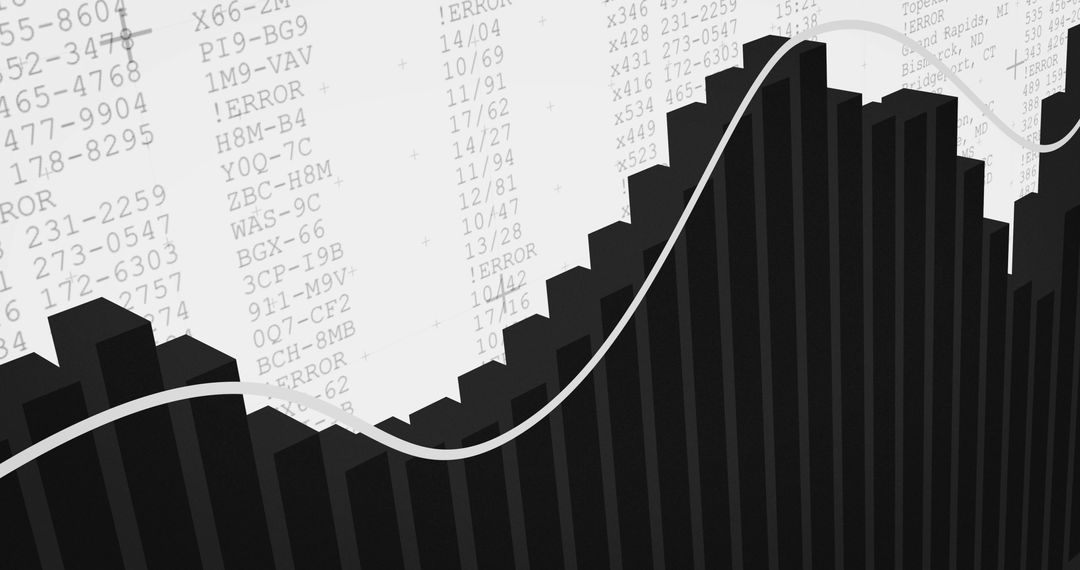
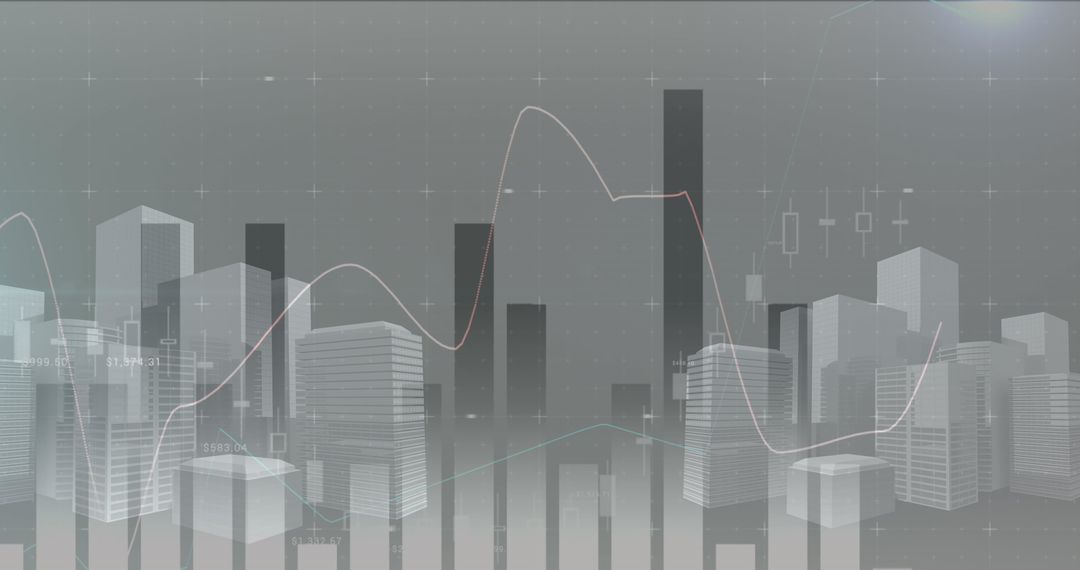
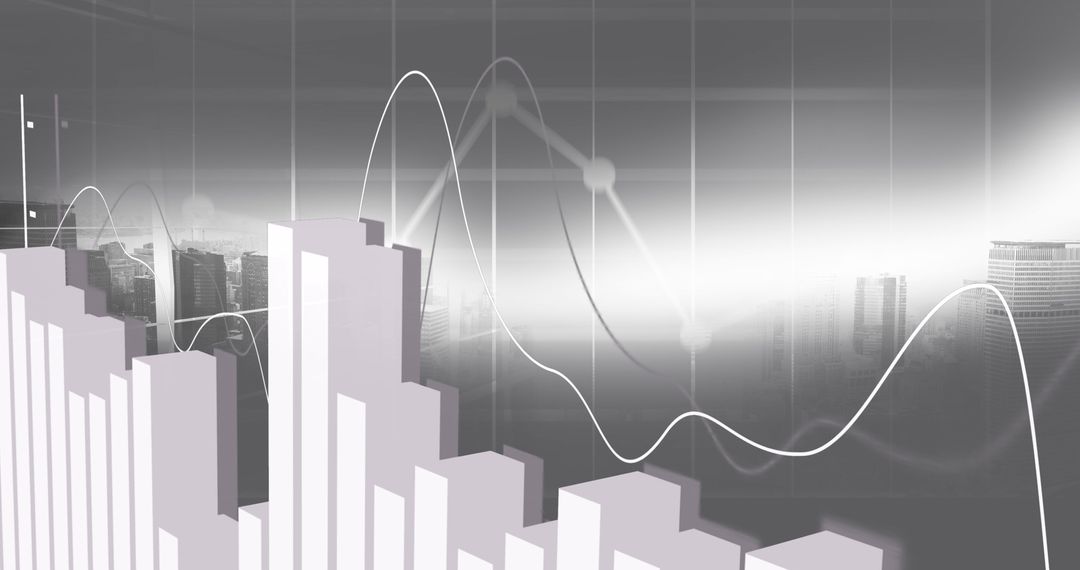
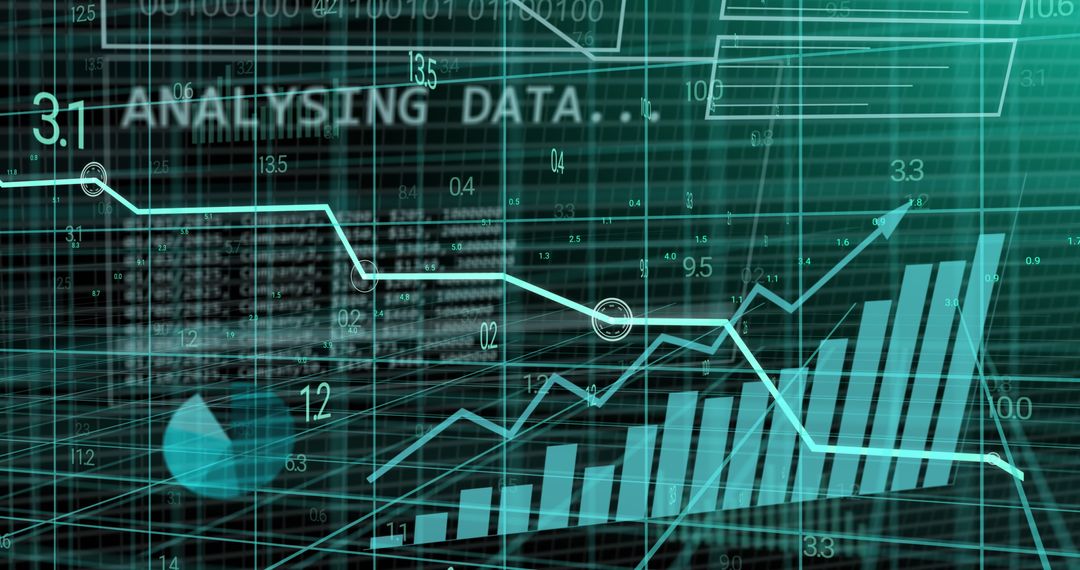
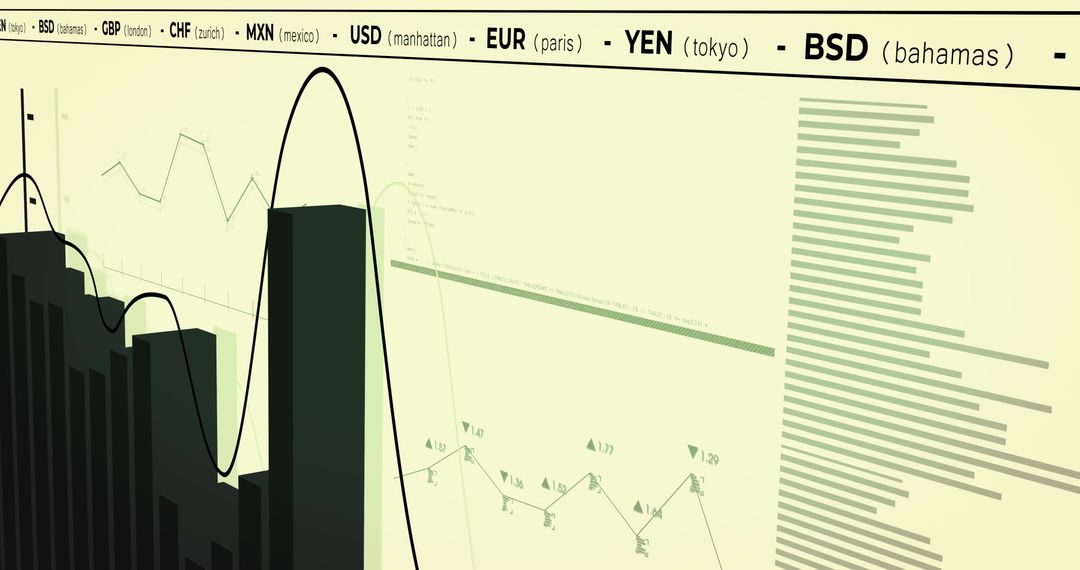
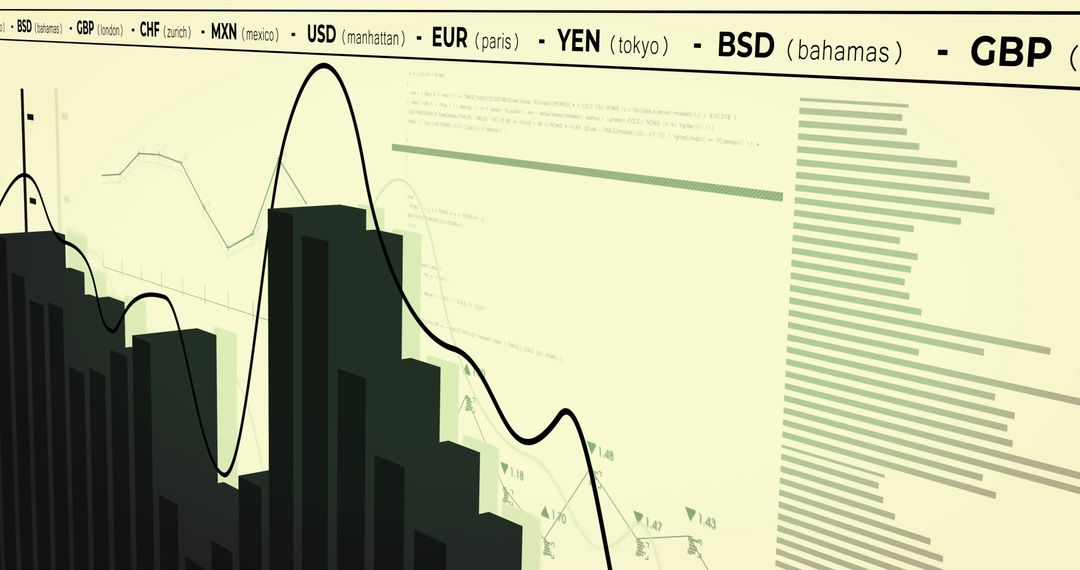
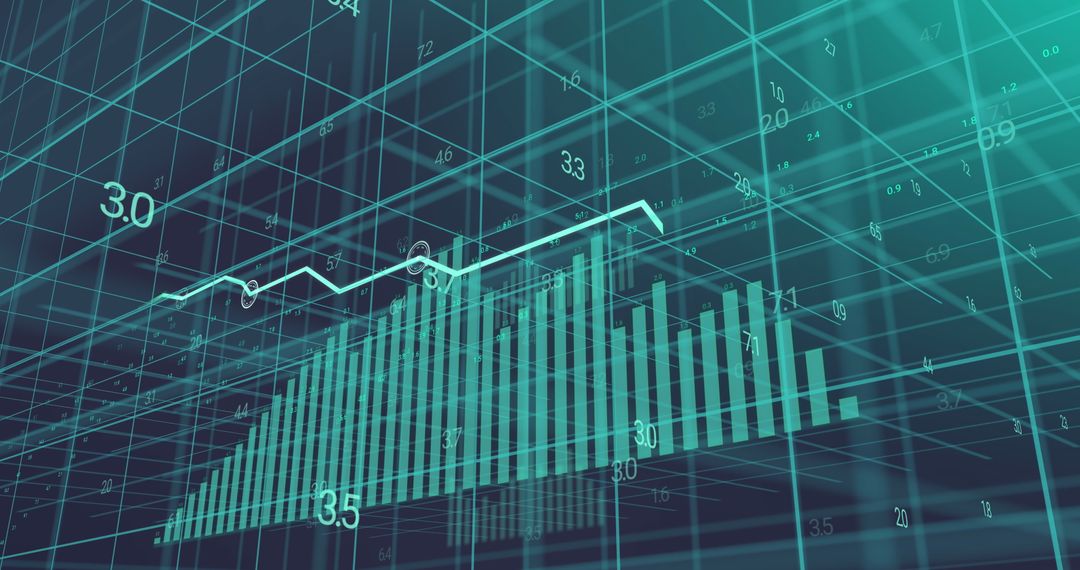
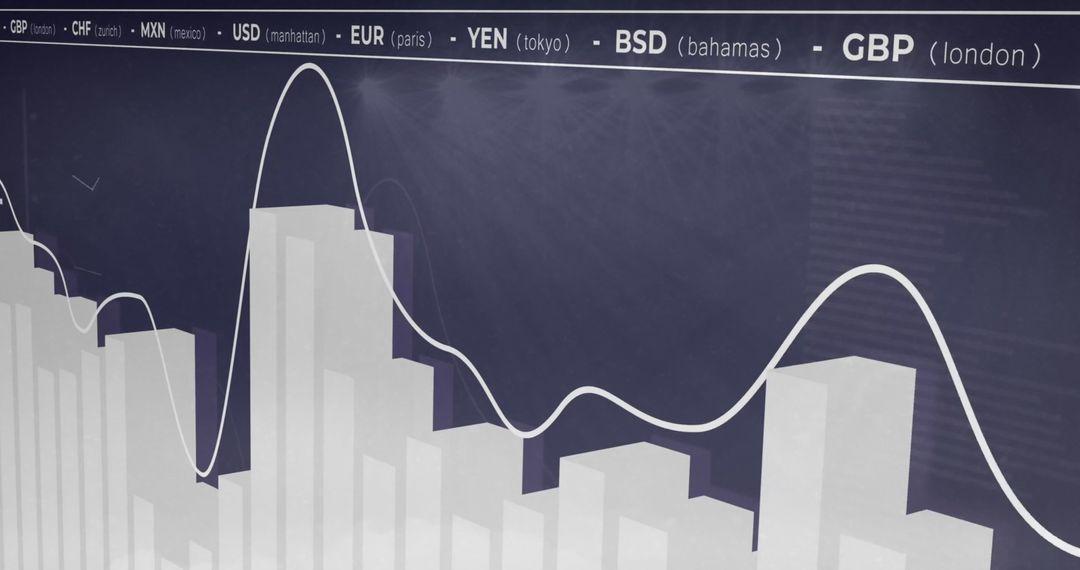
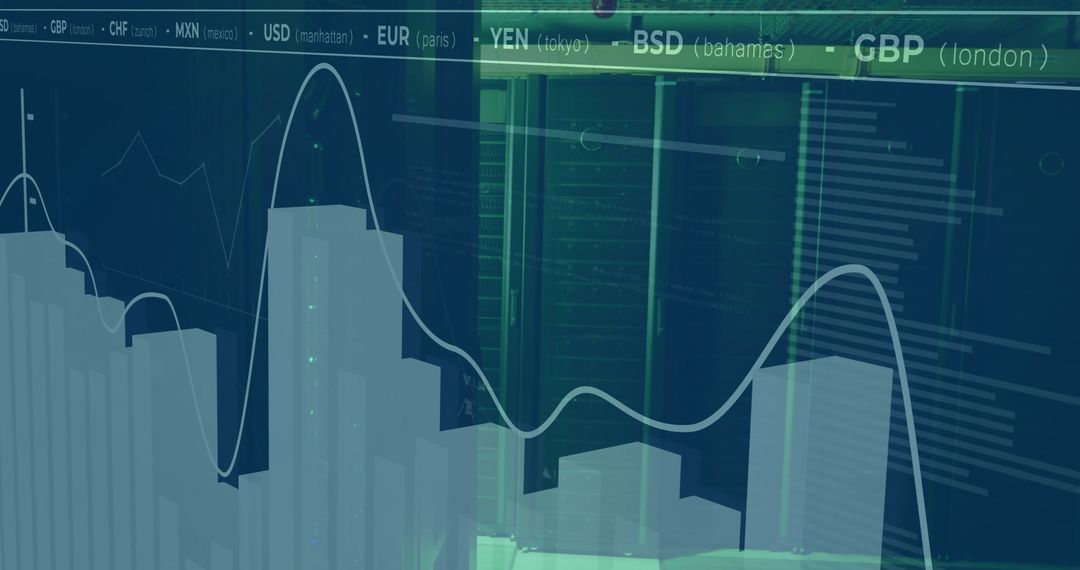
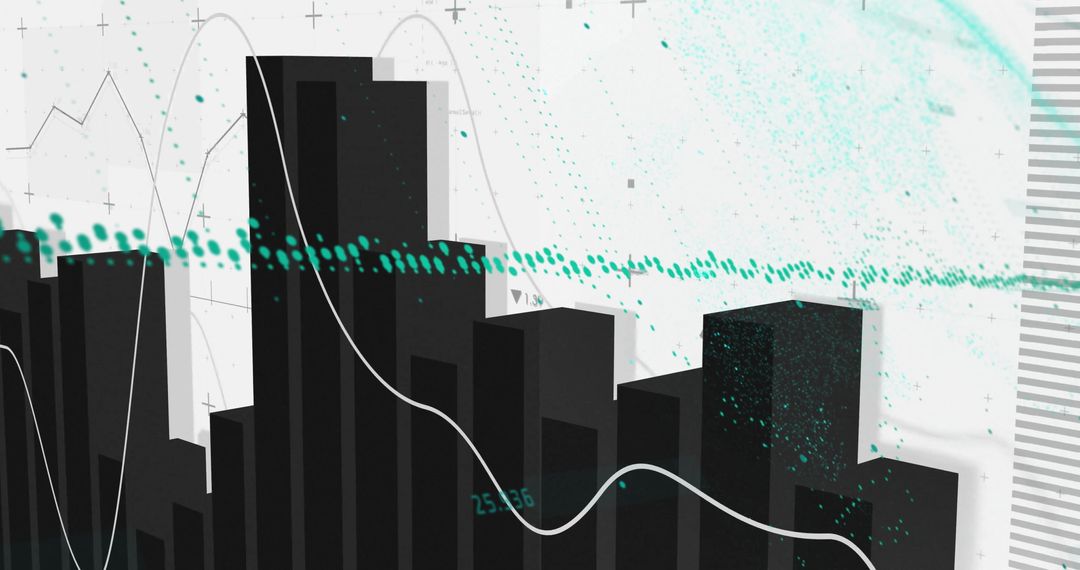
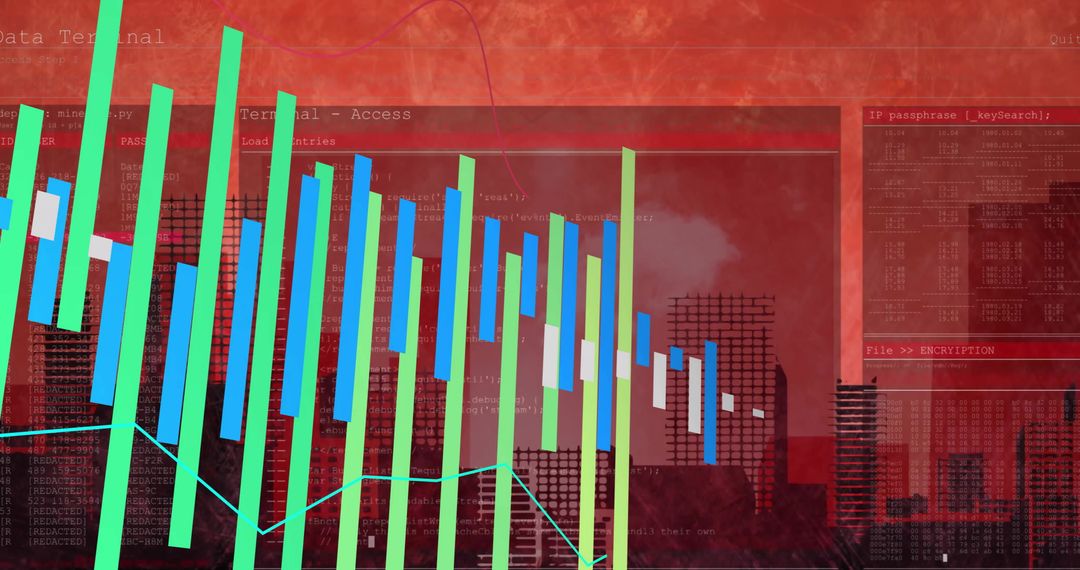
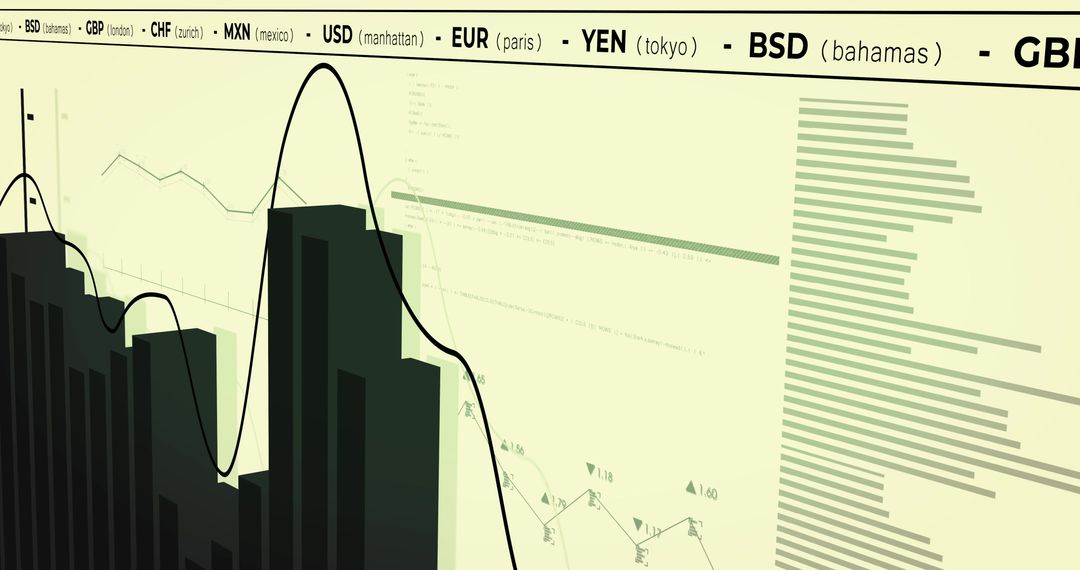
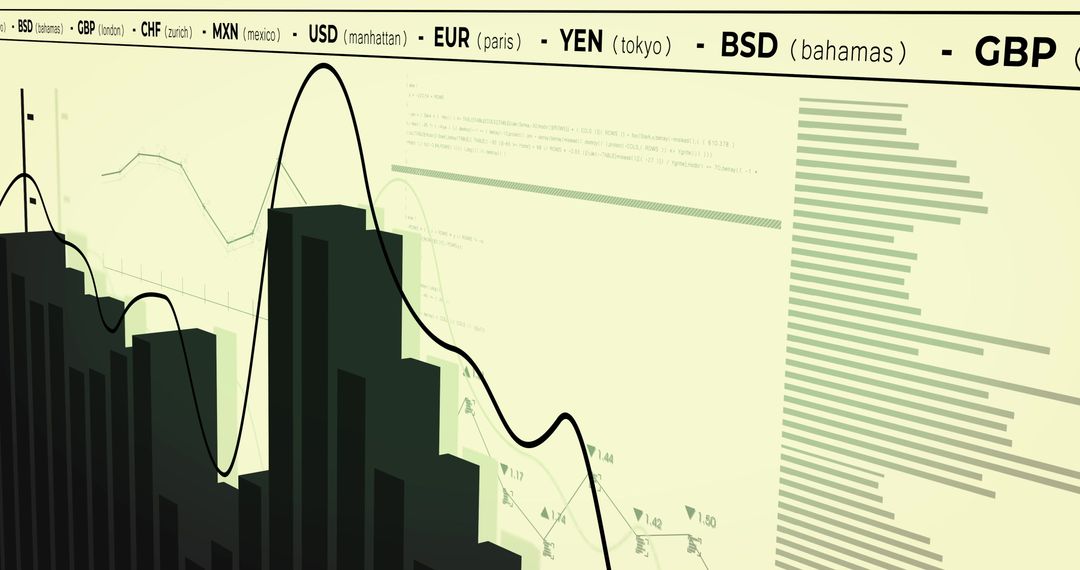
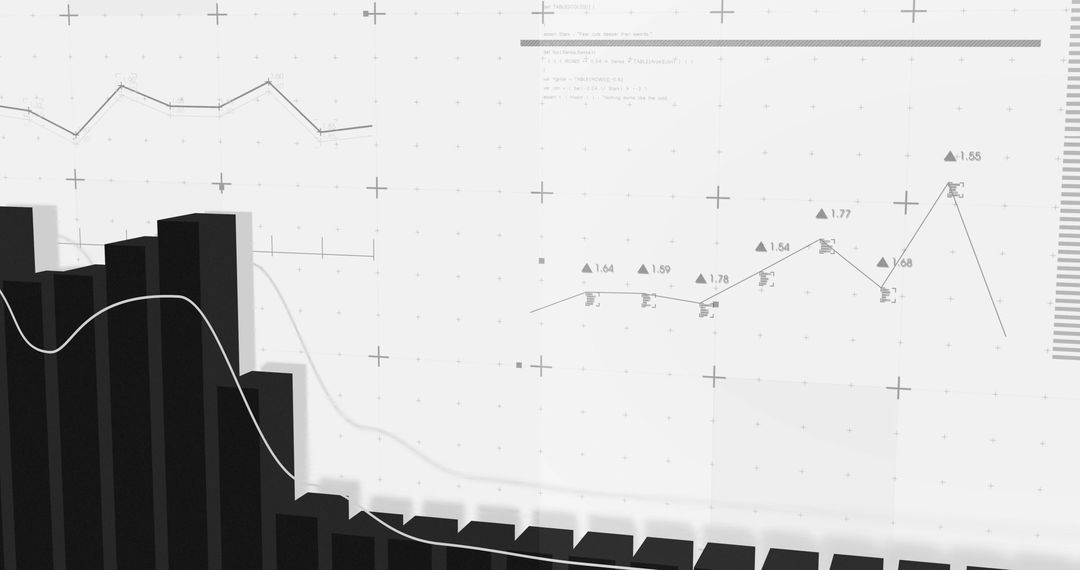
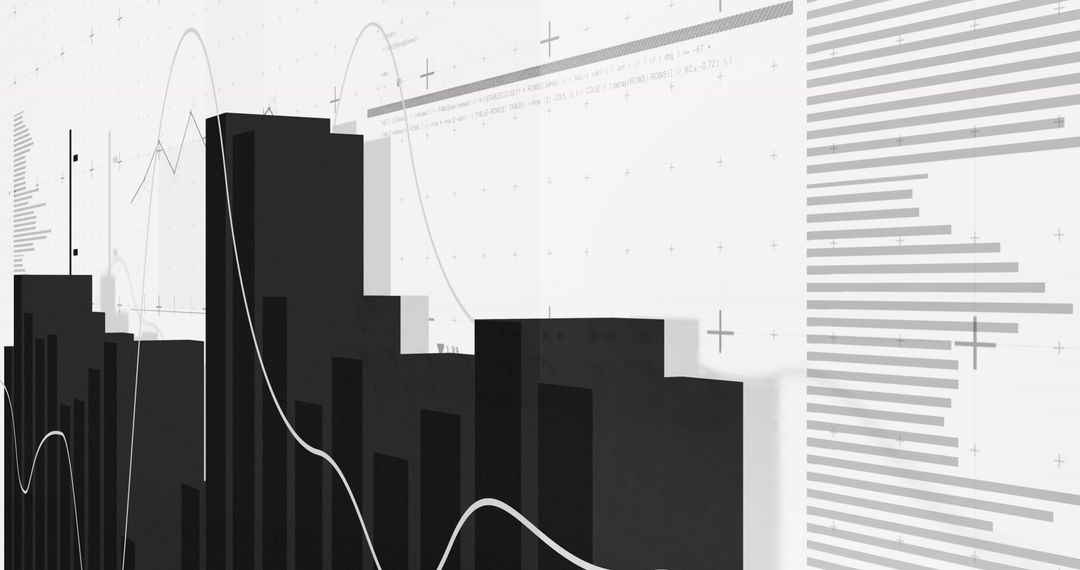
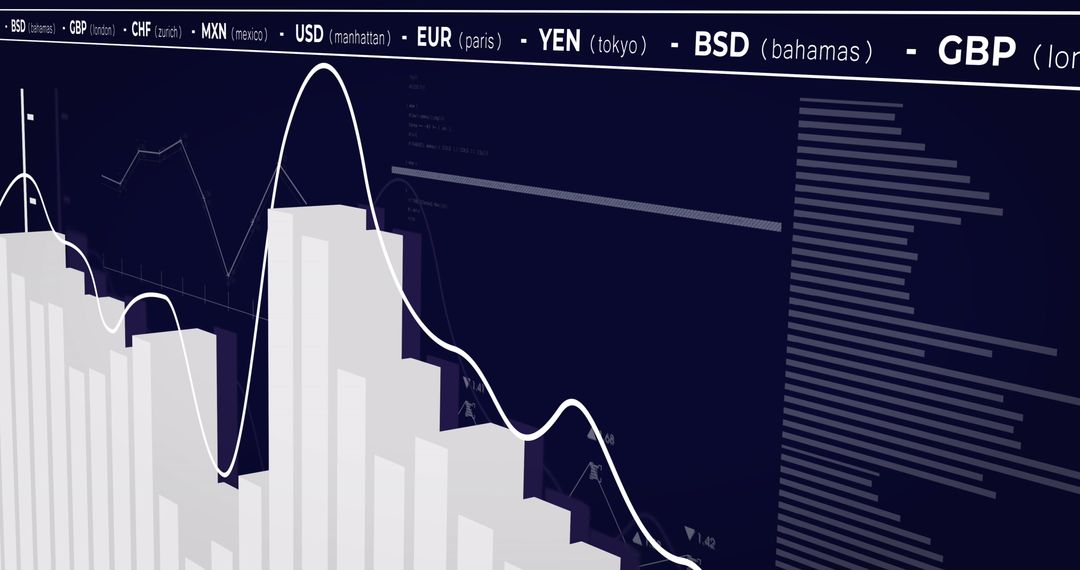
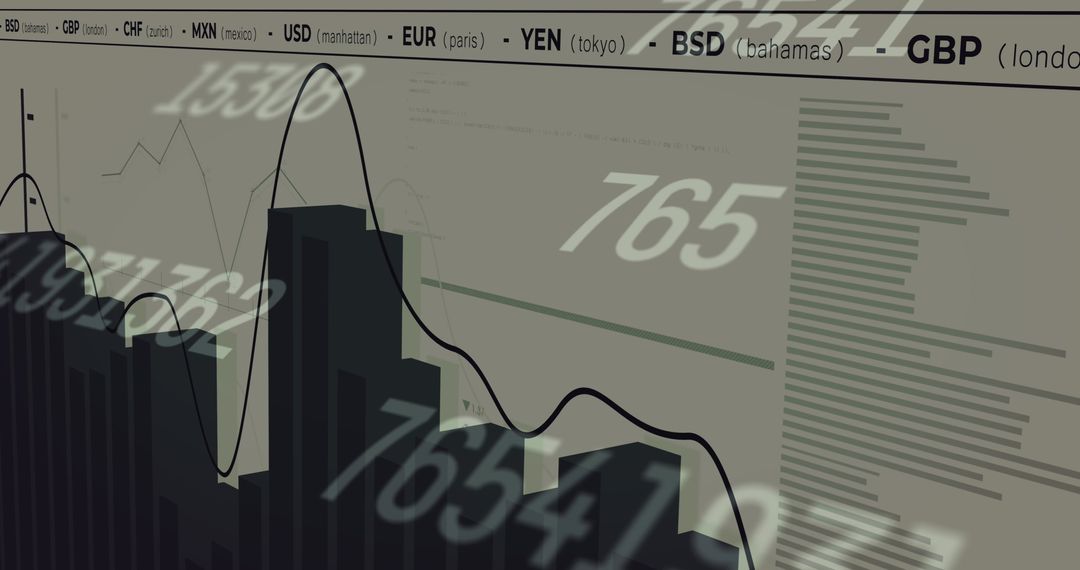
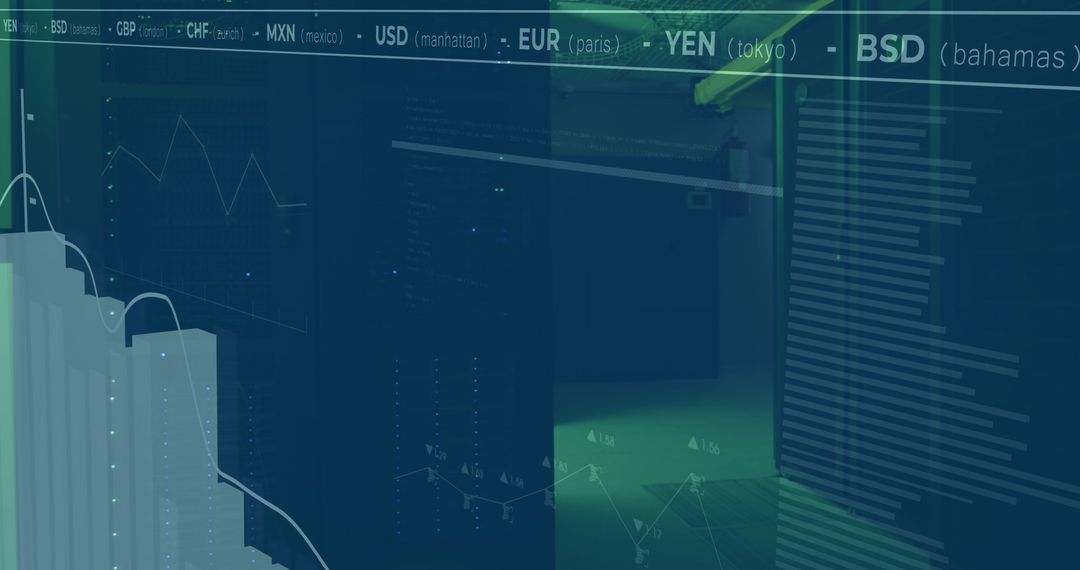
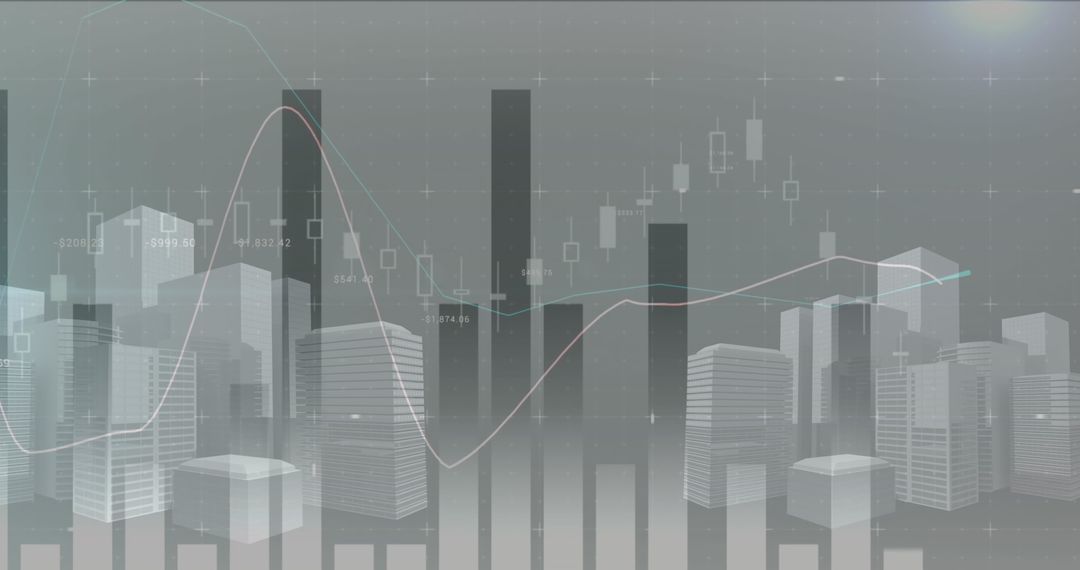
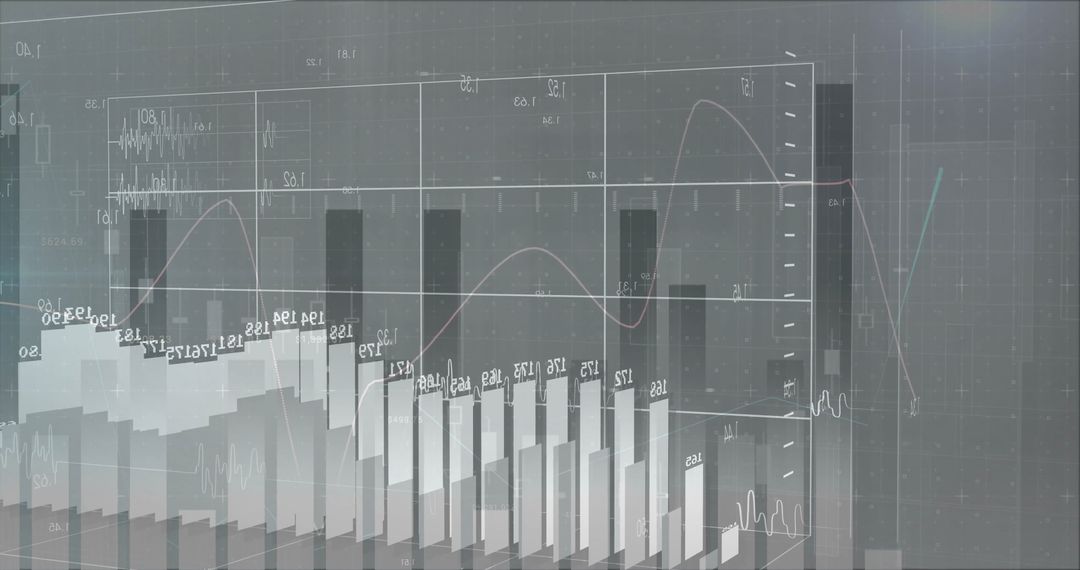
- Digital Composite of Currency and Financial Graphs in Data Center
Digital Composite of Currency and Financial Graphs in Data Center Image
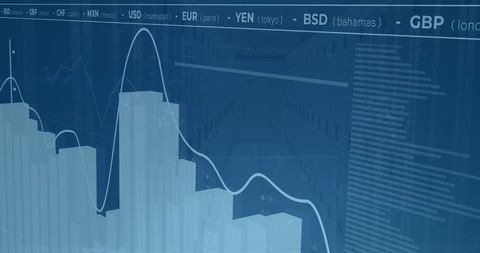
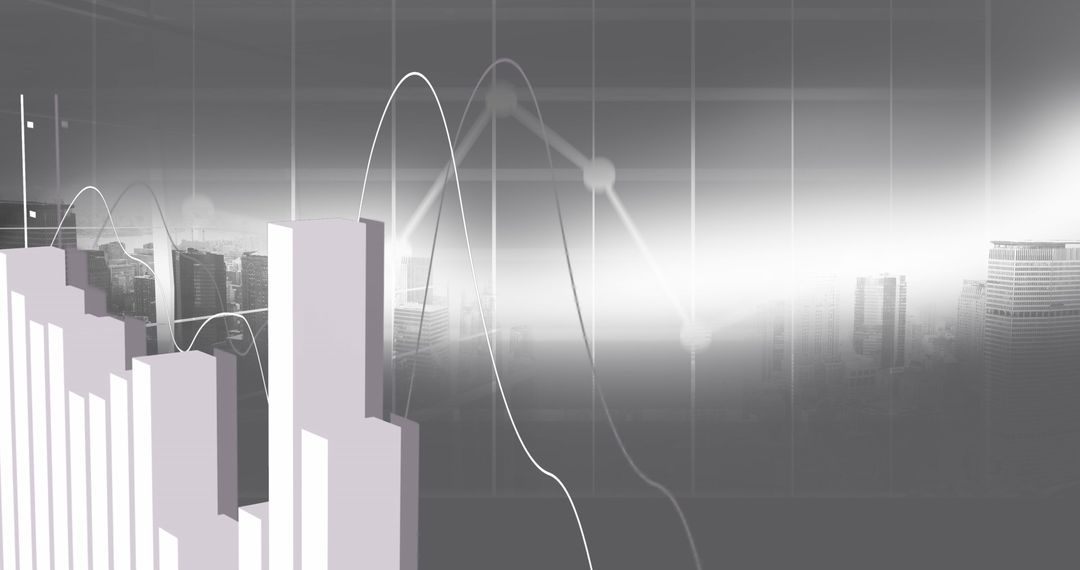
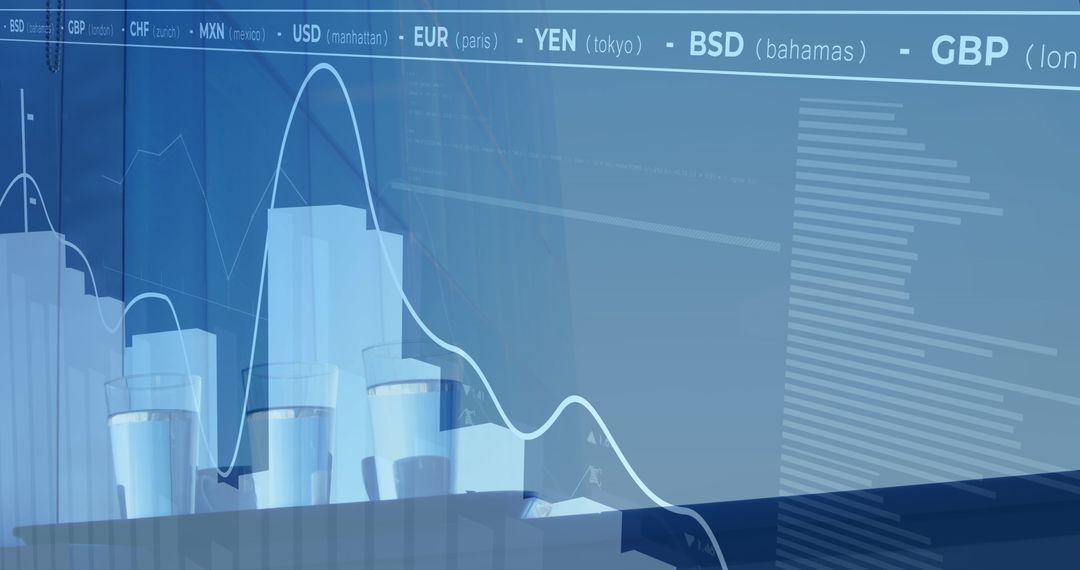
This image displays a blend of financial graphs and global currency symbols, set against the backdrop of a data center. The juxtaposition suggests themes of financial analysis, economic data processing, and the role of technology in modern finance. It is ideal for use in materials related to economic reports, network security in finance, and analytics in digital environments.
Powered by 


0
downloads
downloads
Tags:
More
Credit Photo
If you would like to credit the Photo, here are some ways you can do so
Text Link
photo Link
<span class="text-link">
<span>
<a target="_blank" href=https://pikwizard.com/photo/digital-composite-of-currency-and-financial-graphs-in-data-center/60480f9e0bc3dee871f5973e82abc500/>PikWizard</a>
</span>
</span>
<span class="image-link">
<span
style="margin: 0 0 20px 0; display: inline-block; vertical-align: middle; width: 100%;"
>
<a
target="_blank"
href="https://pikwizard.com/photo/digital-composite-of-currency-and-financial-graphs-in-data-center/60480f9e0bc3dee871f5973e82abc500/"
style="text-decoration: none; font-size: 10px; margin: 0;"
>
<img src="https://pikwizard.com/pw/medium/60480f9e0bc3dee871f5973e82abc500.jpg" style="margin: 0; width: 100%;" alt="" />
<p style="font-size: 12px; margin: 0;">PikWizard</p>
</a>
</span>
</span>
Free (free of charge)
Free for personal and commercial use.
Author: People Creations
Similar Free Stock Images
Premium


Premium

Premium


Premium

Premium


Premium


Premium

Premium

Premium


Premium


Premium


Premium


Premium


Premium


Premium


Premium


Premium

Premium


Premium


Premium


Premium


Premium


Premium

Premium