- Home >
- Stock Photos >
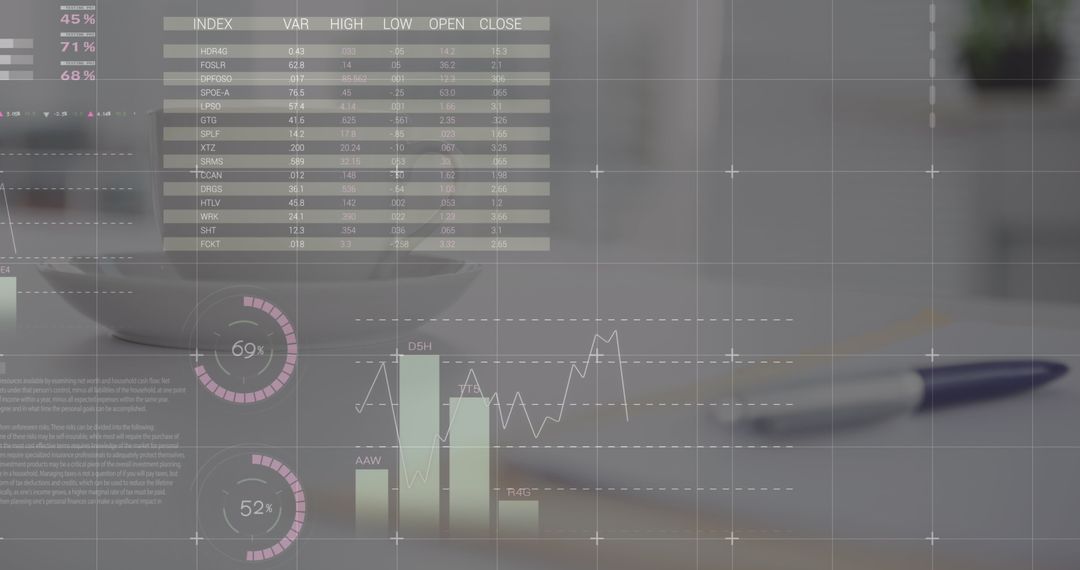
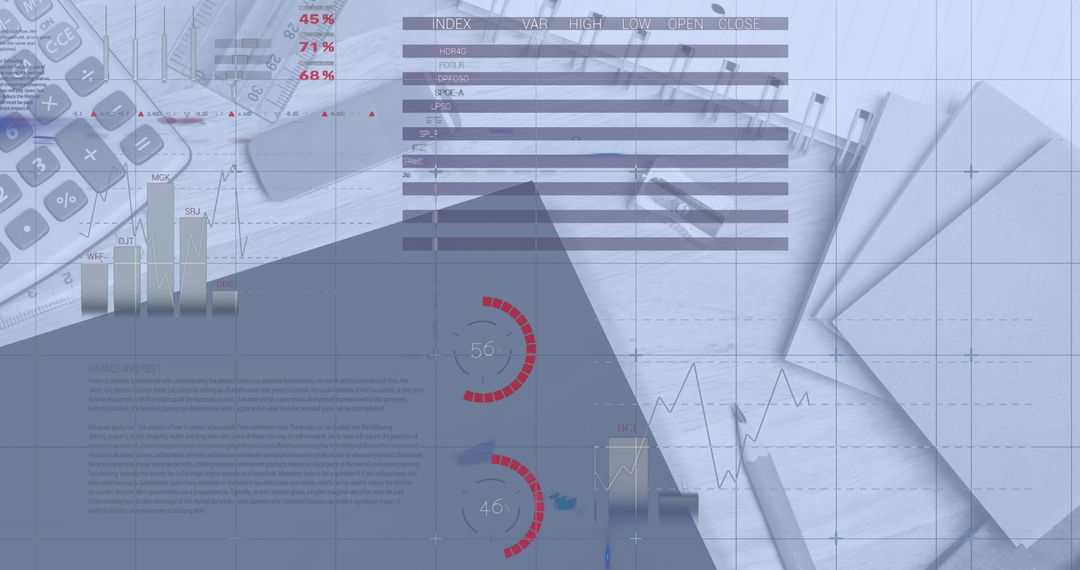
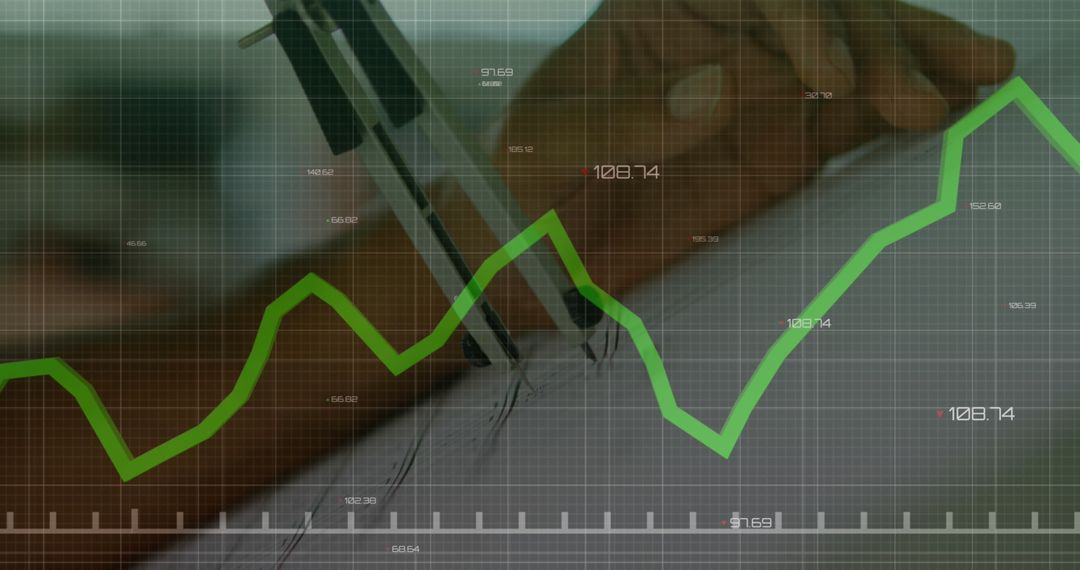
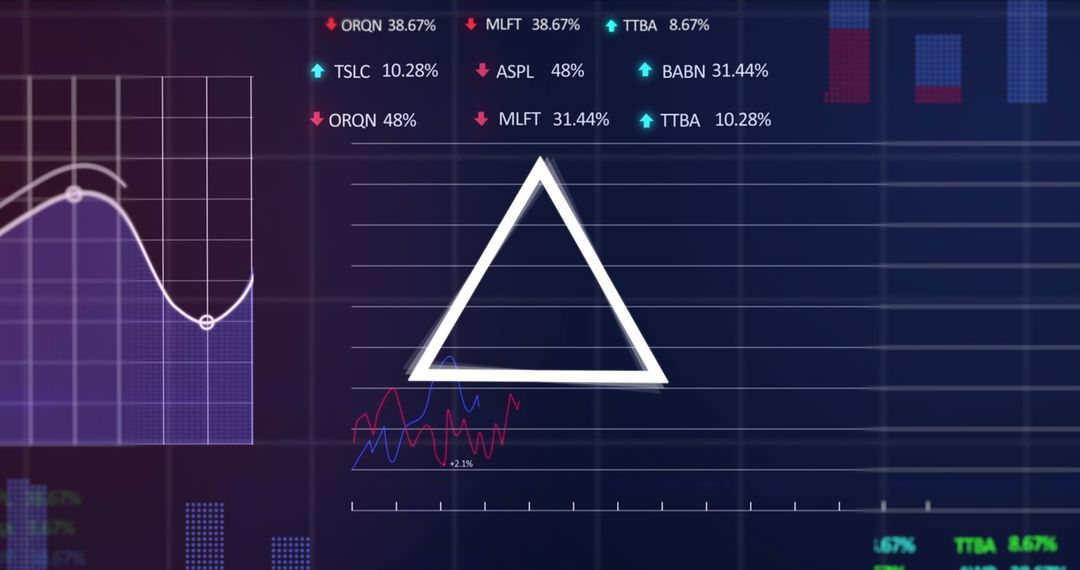
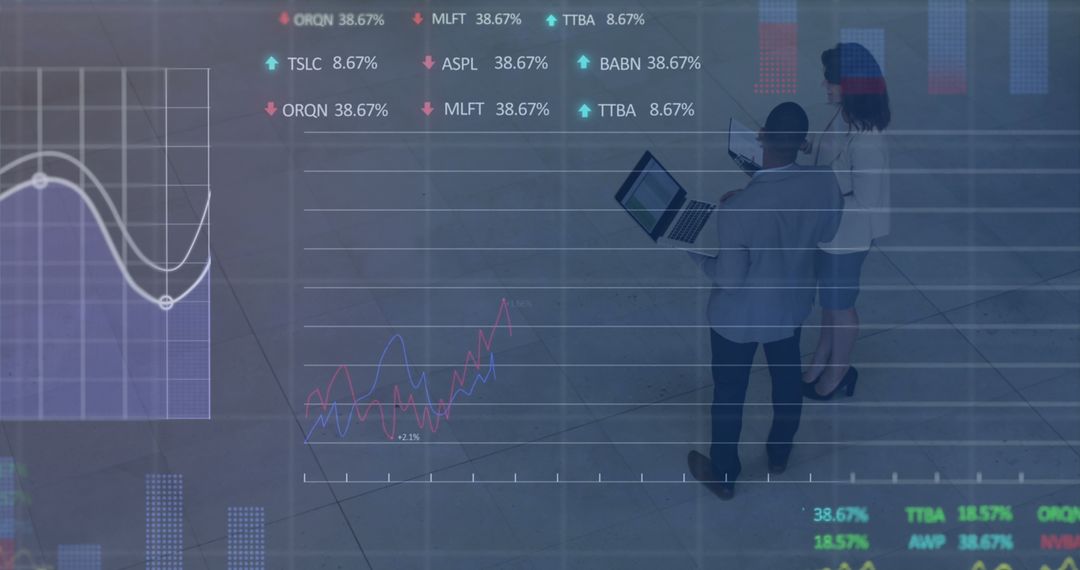
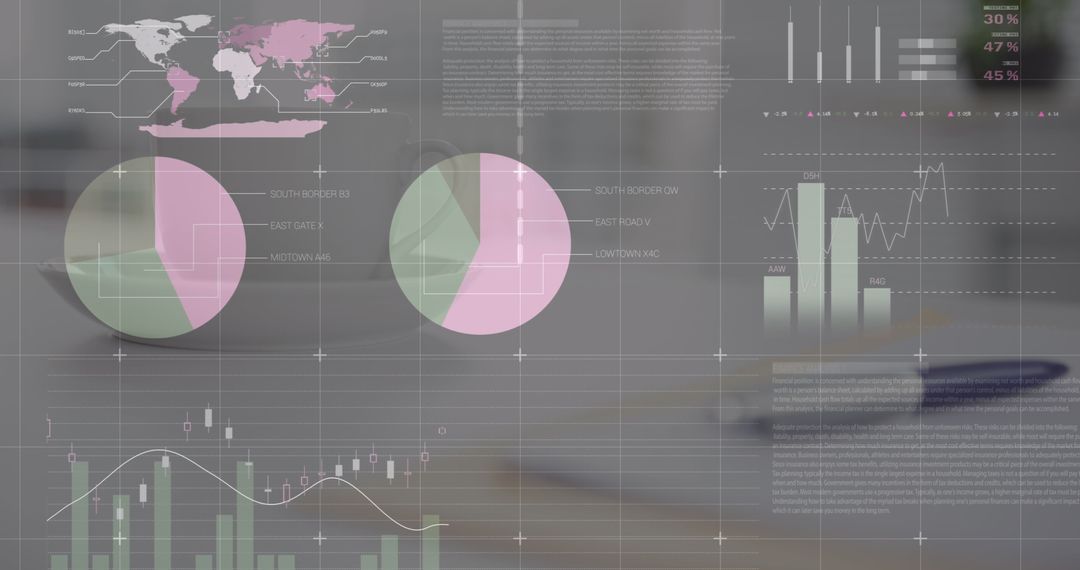
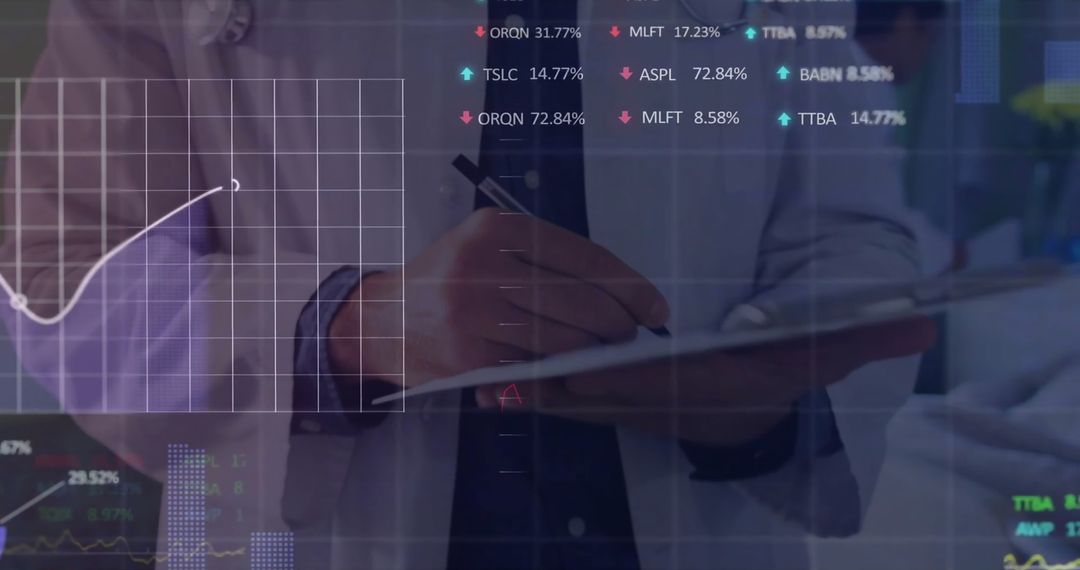
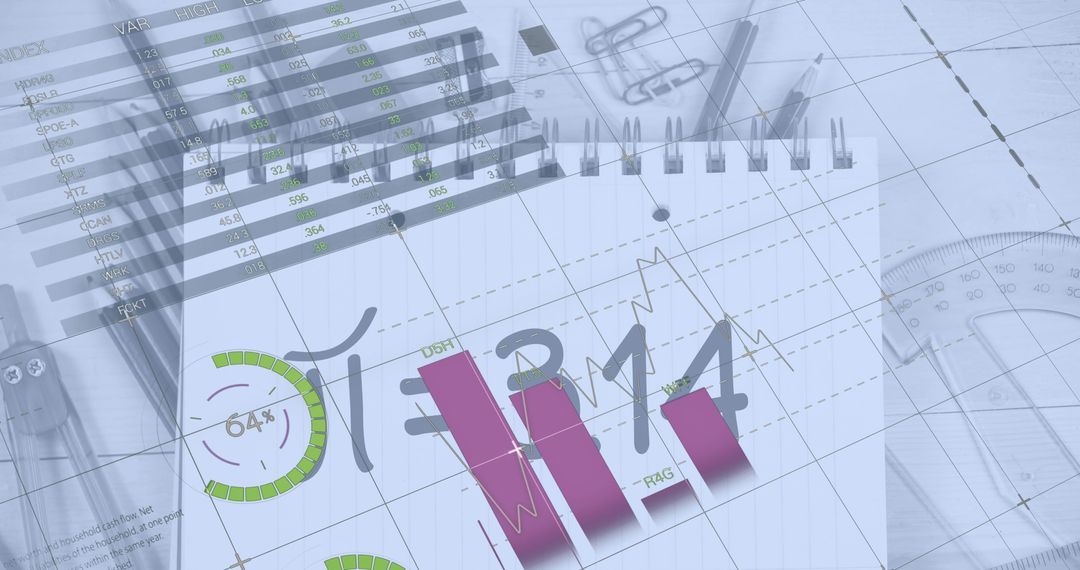
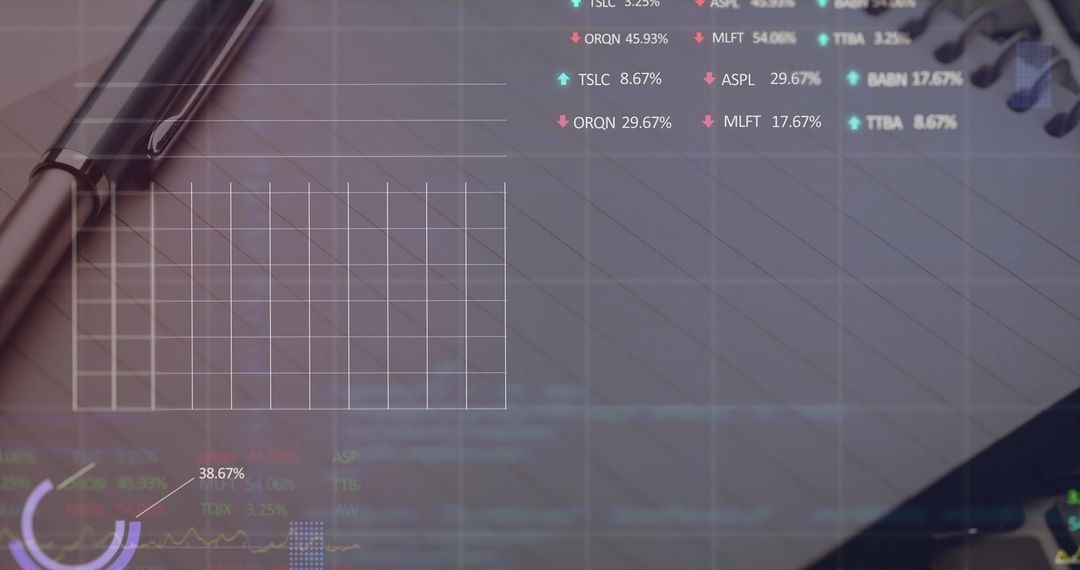
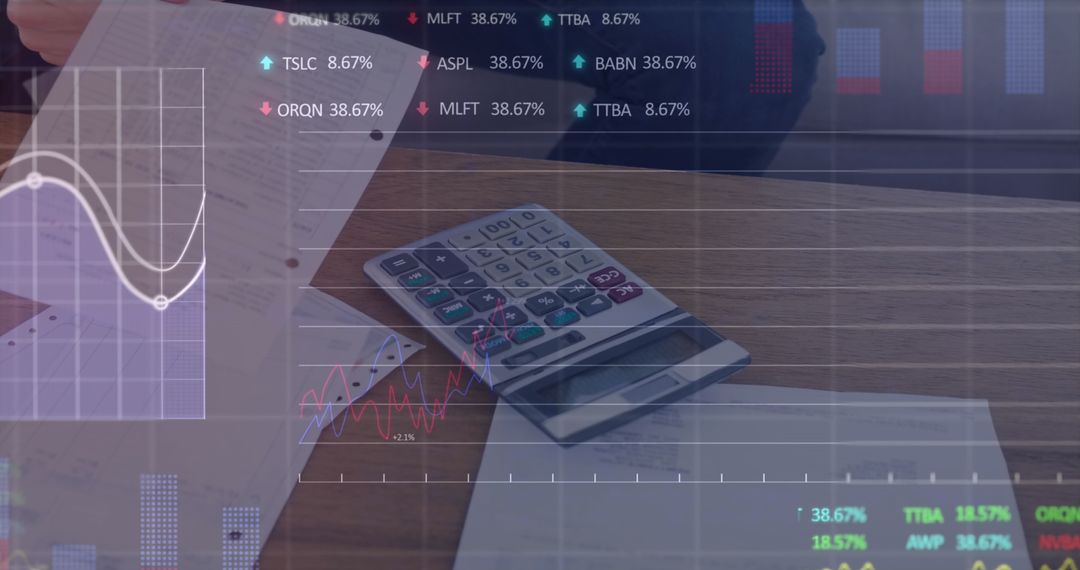
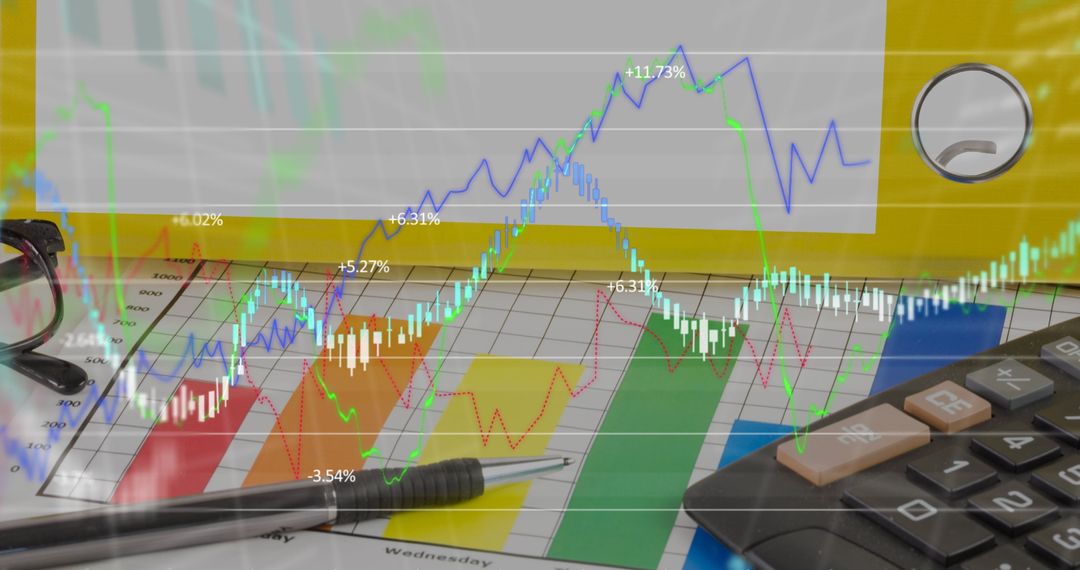
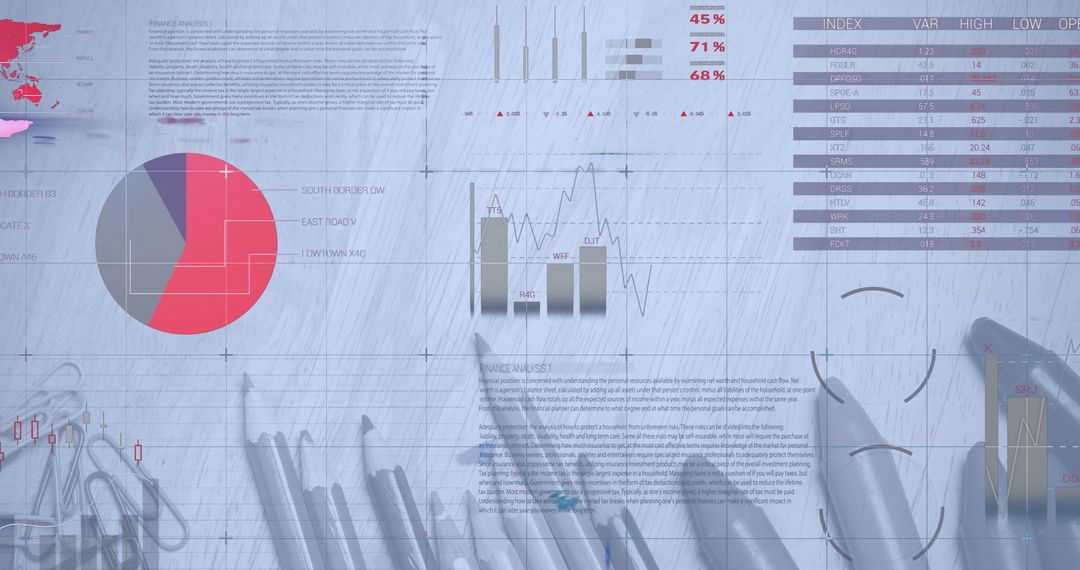
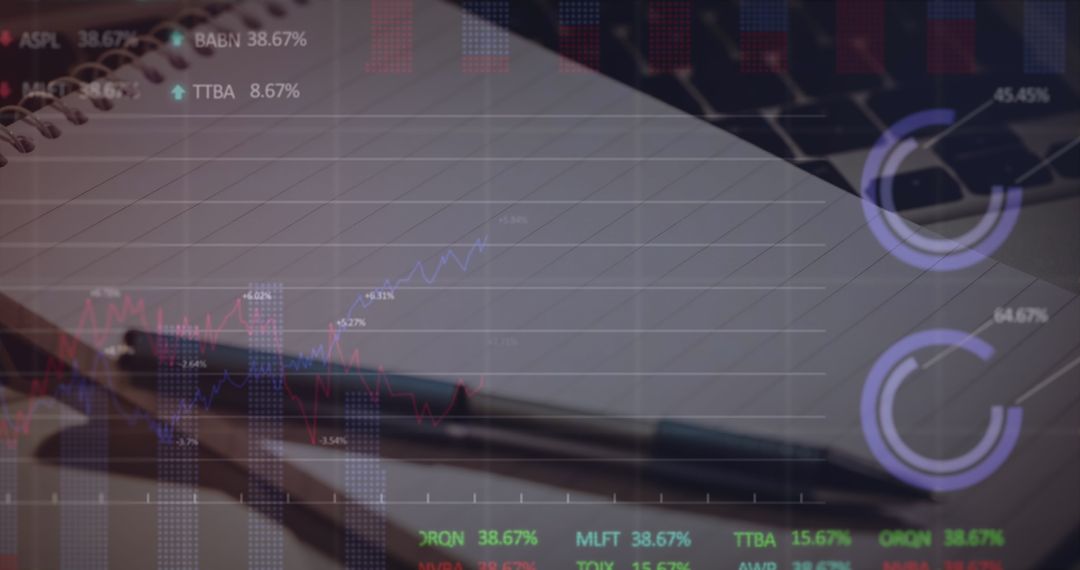
- Digital Composite of Stock Market Trends and Analytics
Digital Composite of Stock Market Trends and Analytics Image
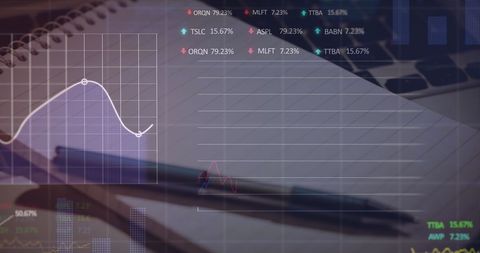
This digital composite showcases multiple graphs and trading boards overlaid on office materials like a notepad and a keyboard, illustrating financial growth and analytics. Ideal for use in business presentations, financial reports, stock market analysis, and technology-related publications.
Powered by  - Get 15% off with code: PIKWIZARD15


2
downloads
downloads
Tags:
More
Credit Photo
If you would like to credit the Photo, here are some ways you can do so
Text Link
photo Link
<span class="text-link">
<span>
<a target="_blank" href=https://pikwizard.com/photo/digital-composite-of-stock-market-trends-and-analytics/873a785193d84ed00c8768a4f612f7d9/>PikWizard</a>
</span>
</span>
<span class="image-link">
<span
style="margin: 0 0 20px 0; display: inline-block; vertical-align: middle; width: 100%;"
>
<a
target="_blank"
href="https://pikwizard.com/photo/digital-composite-of-stock-market-trends-and-analytics/873a785193d84ed00c8768a4f612f7d9/"
style="text-decoration: none; font-size: 10px; margin: 0;"
>
<img src="https://pikwizard.com/pw/medium/873a785193d84ed00c8768a4f612f7d9.jpg" style="margin: 0; width: 100%;" alt="" />
<p style="font-size: 12px; margin: 0;">PikWizard</p>
</a>
</span>
</span>
Free (free of charge)
Free for personal and commercial use.
Author: Creative Art
Similar Free Stock Images

Premium


Premium


Premium


Premium


Premium


Premium


Premium


Premium


Premium


Premium


Premium


Premium


Premium


Premium


Premium


Premium


Premium


Premium


Premium


Premium


Premium


Premium


Premium


Premium