
- Home >
- Stock Photos >
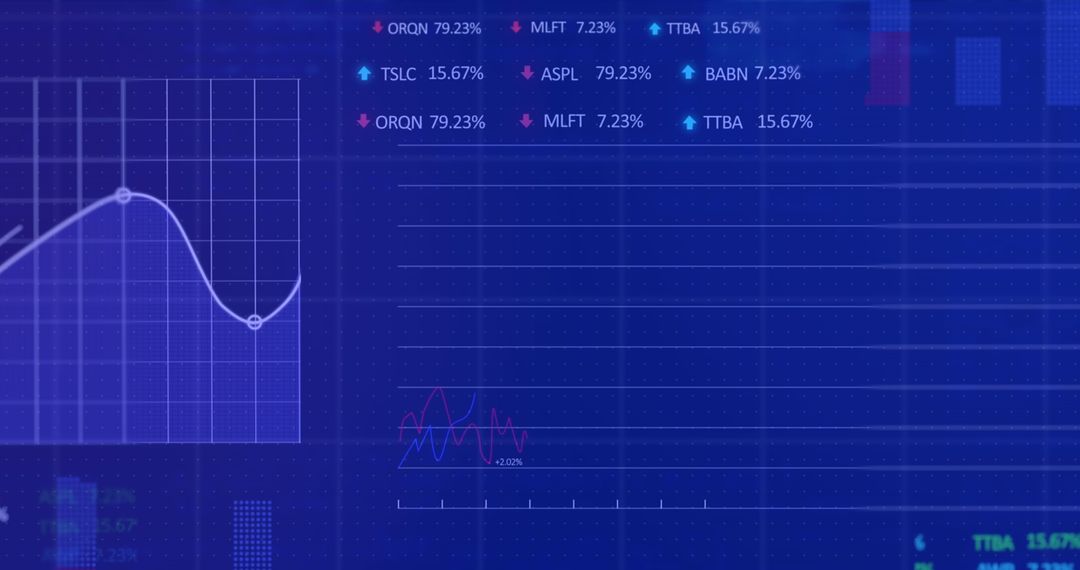
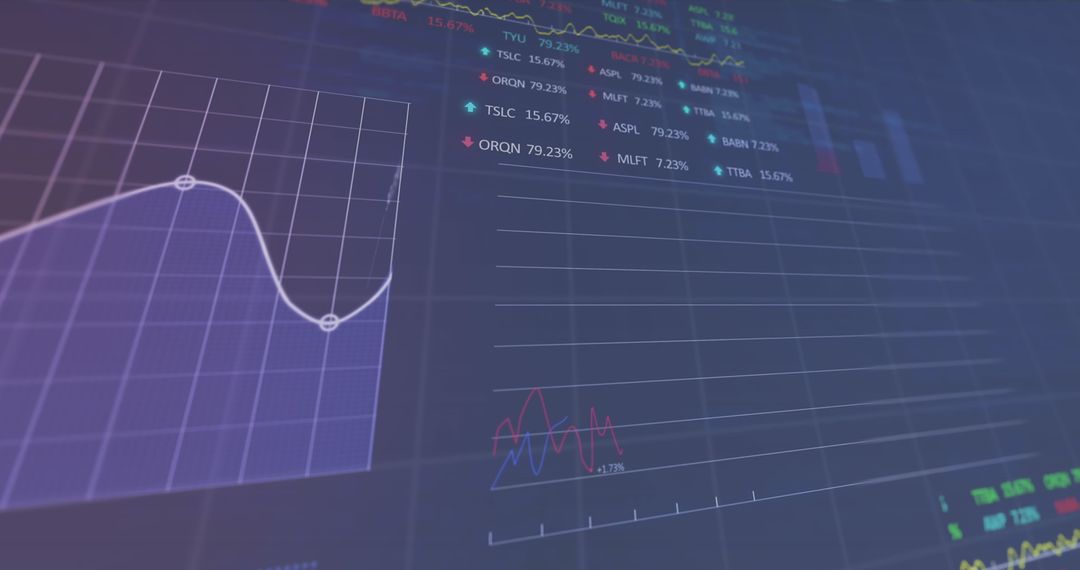
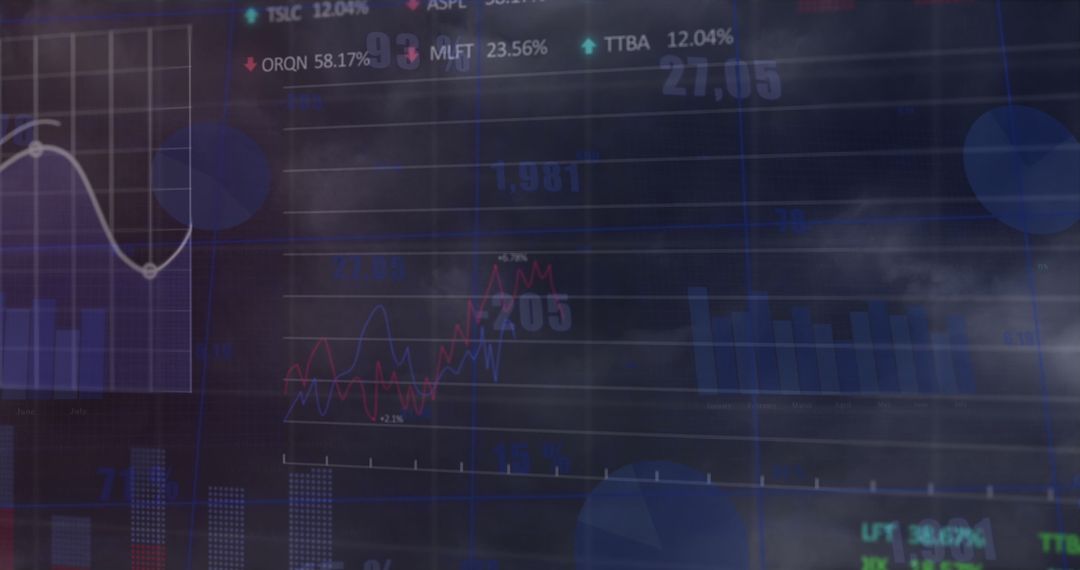
- Digital Data Analysis with Financial Charts and Graphs
Digital Data Analysis with Financial Charts and Graphs Image

Detailed visualization showcasing data analysis with various financial charts and graphs on a blue digital interface. Highlight on technological aspects and market projections, making this perfect for presentations on finance, investment trends, digital marketing, or economic forecasts. Well-suited for content relating to financial education, stock market analysis, or financial technology developments.
Powered by 


2
downloads
downloads
Tags:
More
Credit Photo
If you would like to credit the Photo, here are some ways you can do so
Text Link
photo Link
<span class="text-link">
<span>
<a target="_blank" href=https://pikwizard.com/photo/digital-data-analysis-with-financial-charts-and-graphs/aa2fdaed04f40089389011d0e526139e/>PikWizard</a>
</span>
</span>
<span class="image-link">
<span
style="margin: 0 0 20px 0; display: inline-block; vertical-align: middle; width: 100%;"
>
<a
target="_blank"
href="https://pikwizard.com/photo/digital-data-analysis-with-financial-charts-and-graphs/aa2fdaed04f40089389011d0e526139e/"
style="text-decoration: none; font-size: 10px; margin: 0;"
>
<img src="https://pikwizard.com/pw/medium/aa2fdaed04f40089389011d0e526139e.jpg" style="margin: 0; width: 100%;" alt="" />
<p style="font-size: 12px; margin: 0;">PikWizard</p>
</a>
</span>
</span>
Free (free of charge)
Free for personal and commercial use.
Author: Creative Art
Similar Free Stock Images

Premium


Premium


Premium


Premium


Premium


Premium


Premium


Premium


Premium


Premium


Premium


Premium


Premium


Premium


Premium


Premium


Premium


Premium


Premium


Premium


Premium


Premium


Premium


Premium

