- Home >
- Stock Photos >
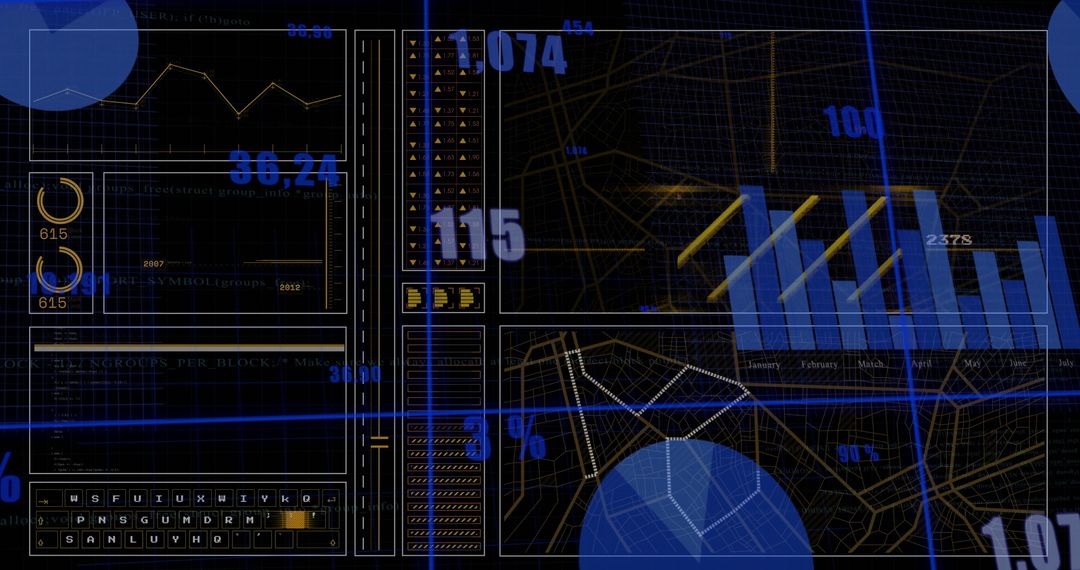
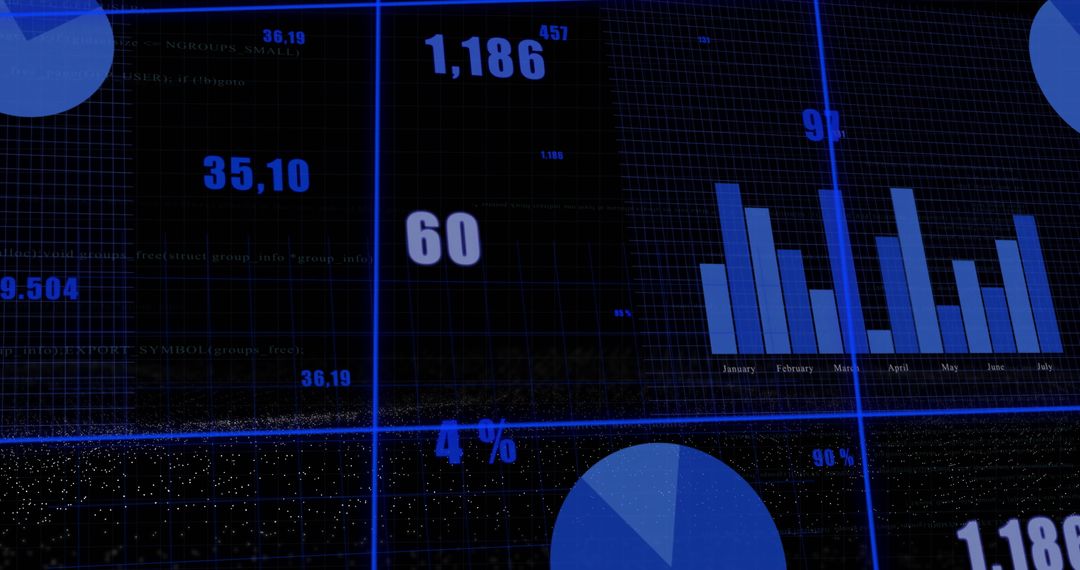
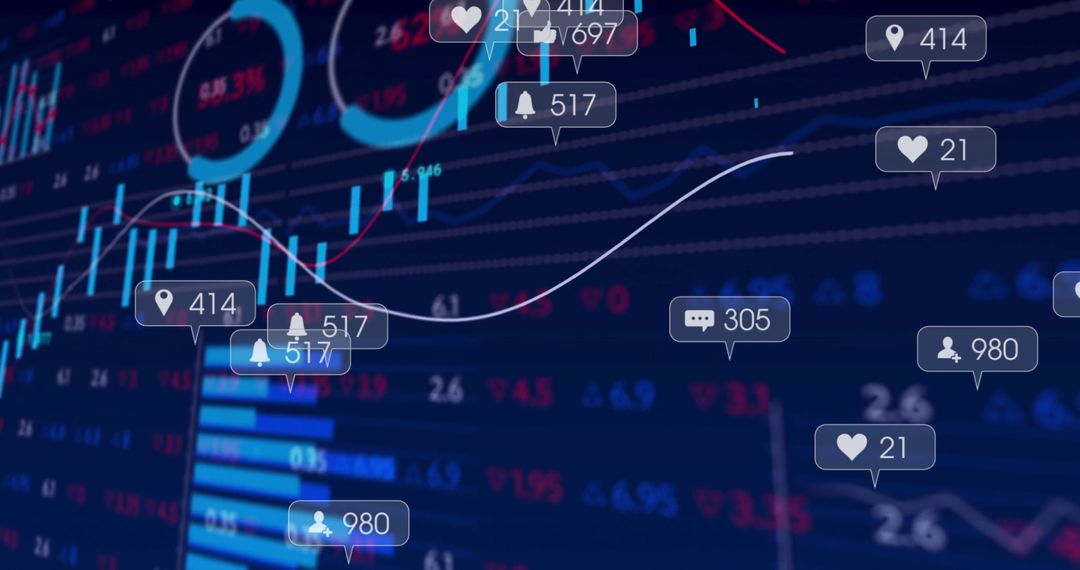
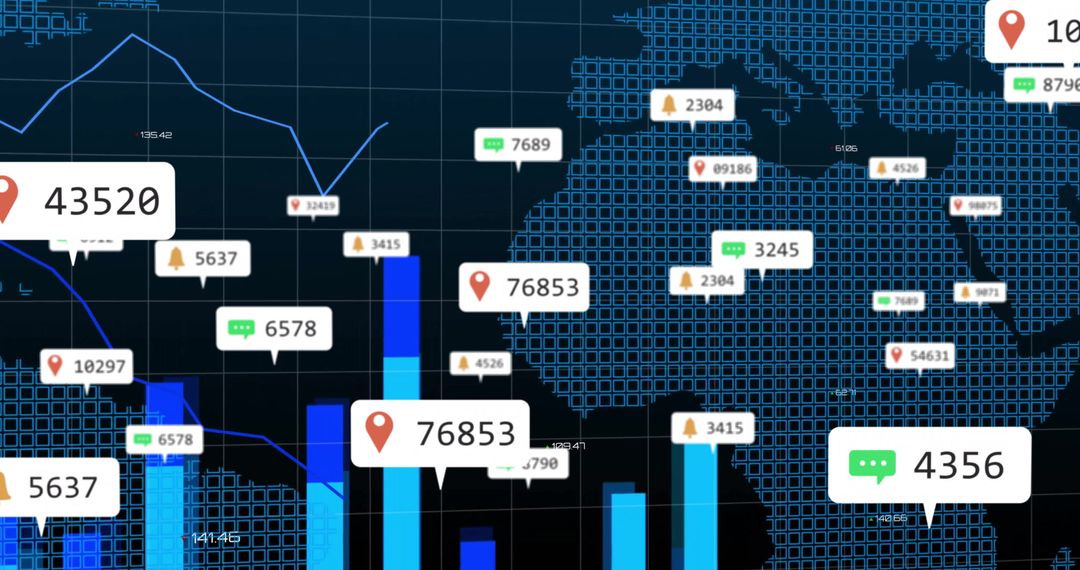
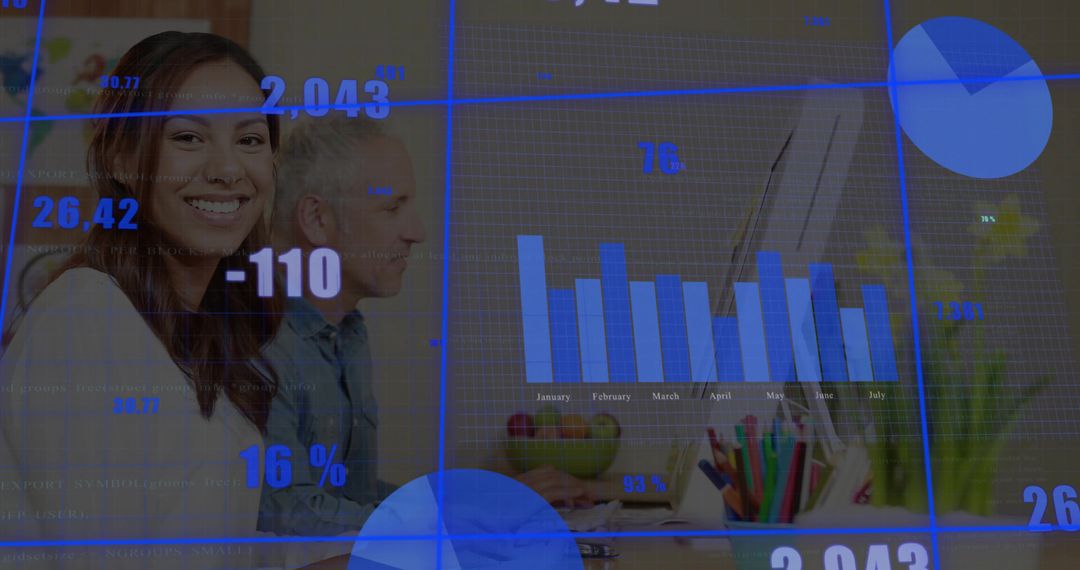
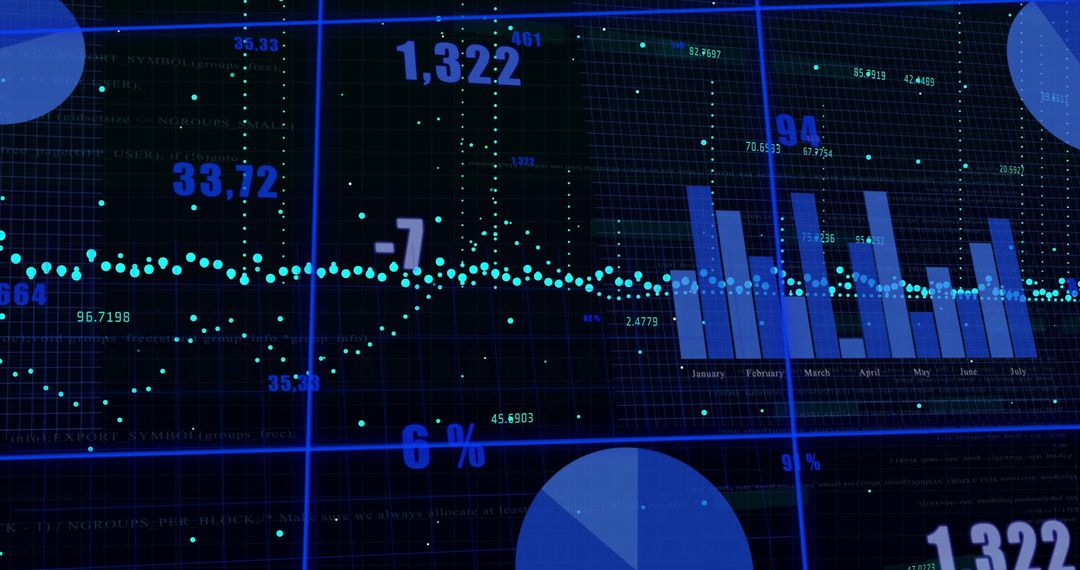
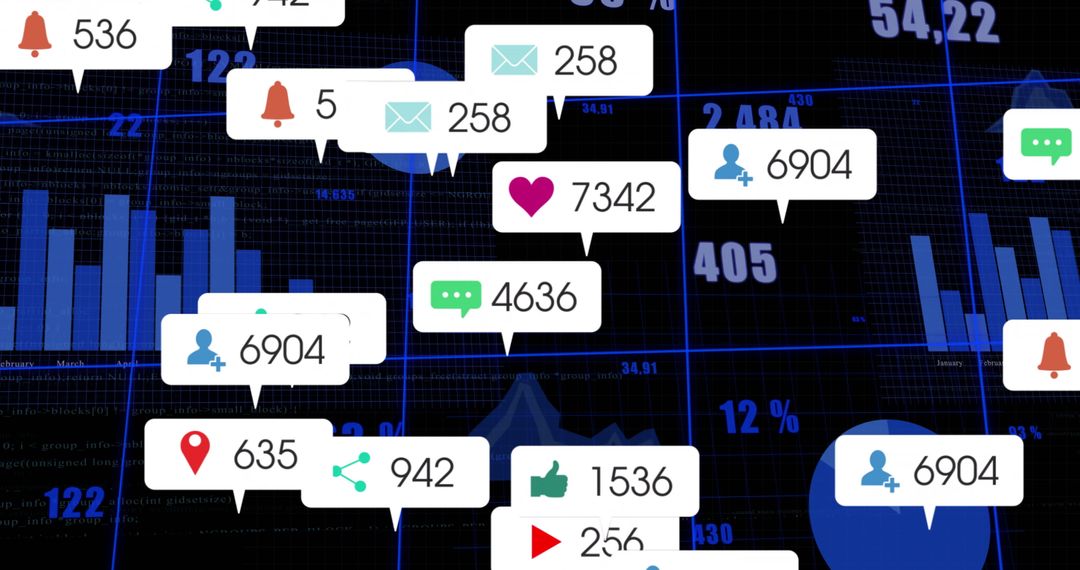
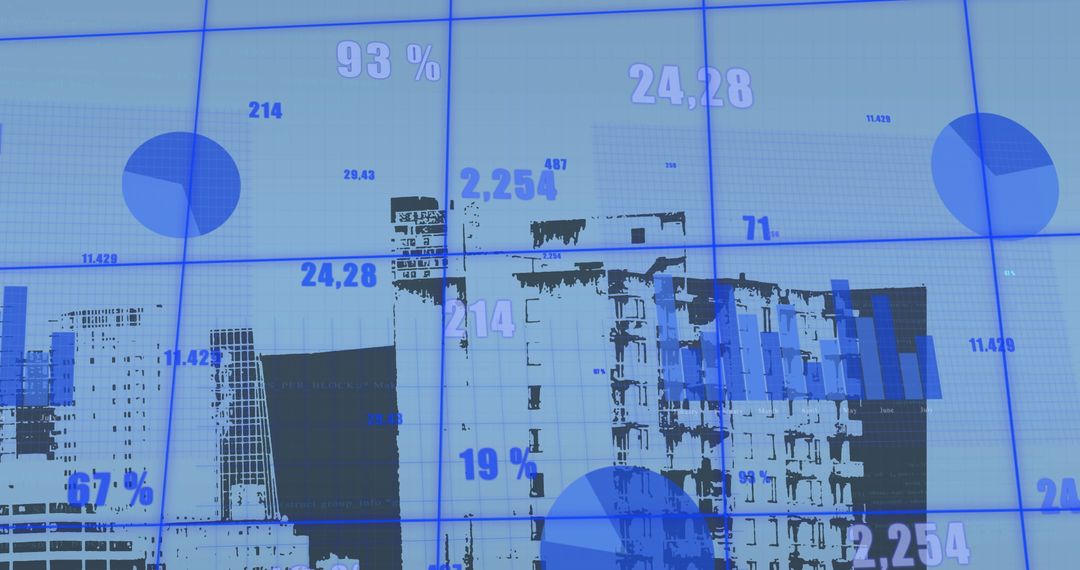
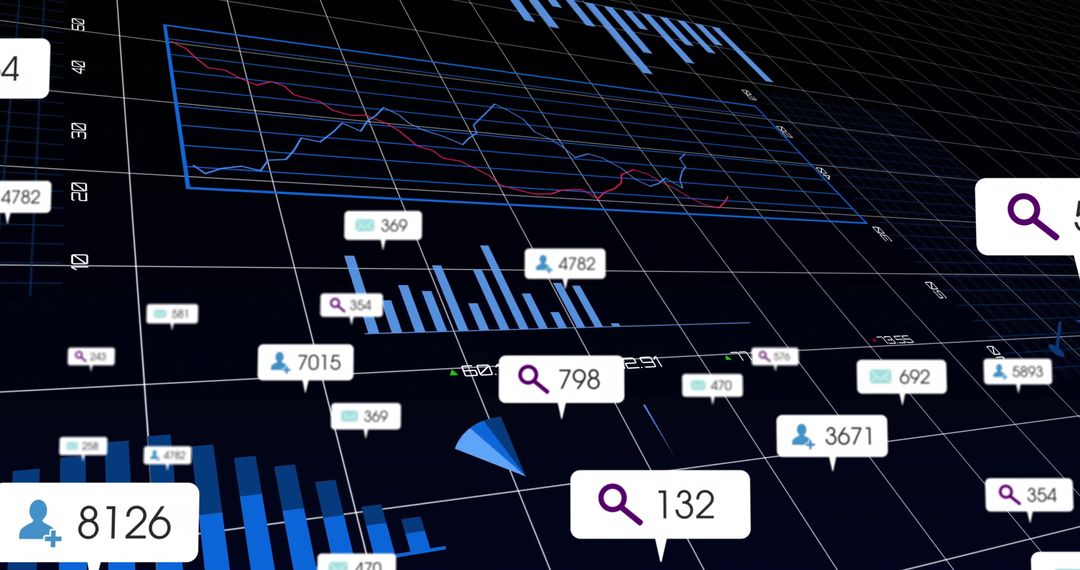
- Digital Data Dashboard with Social Media Analytics and Charts
Digital Data Dashboard with Social Media Analytics and Charts Image

This visualization illustrates a digital dashboard combining data analytics and social media metrics. Featuring bar and pie charts with numeric labels alongside social media interaction icons, it suggests a modern approach to presenting complex statistics. Ideal for businesses and digital marketers aiming to communicate insights visually, this concept is useful in presentations, reports, or as a tool on technology-related websites.
Powered by  - Get 15% off with code: PIKWIZARD15


0
downloads
downloads
Tags:
More
Credit Photo
If you would like to credit the Photo, here are some ways you can do so
Text Link
photo Link
<span class="text-link">
<span>
<a target="_blank" href=https://pikwizard.com/photo/digital-data-dashboard-with-social-media-analytics-and-charts/62aea5a0c6e9dcd06ec87c4751c4c9d4/>PikWizard</a>
</span>
</span>
<span class="image-link">
<span
style="margin: 0 0 20px 0; display: inline-block; vertical-align: middle; width: 100%;"
>
<a
target="_blank"
href="https://pikwizard.com/photo/digital-data-dashboard-with-social-media-analytics-and-charts/62aea5a0c6e9dcd06ec87c4751c4c9d4/"
style="text-decoration: none; font-size: 10px; margin: 0;"
>
<img src="https://pikwizard.com/pw/medium/62aea5a0c6e9dcd06ec87c4751c4c9d4.jpg" style="margin: 0; width: 100%;" alt="" />
<p style="font-size: 12px; margin: 0;">PikWizard</p>
</a>
</span>
</span>
Free (free of charge)
Free for personal and commercial use.
Author: People Creations
Similar Free Stock Images

Premium


Premium


Premium


Premium


Premium


Premium


Premium


Premium


Premium


Premium


Premium


Premium


Premium


Premium


Premium


Premium


Premium


Premium


Premium


Premium


Premium


Premium


Premium


Premium