- Home >
- Stock Photos >
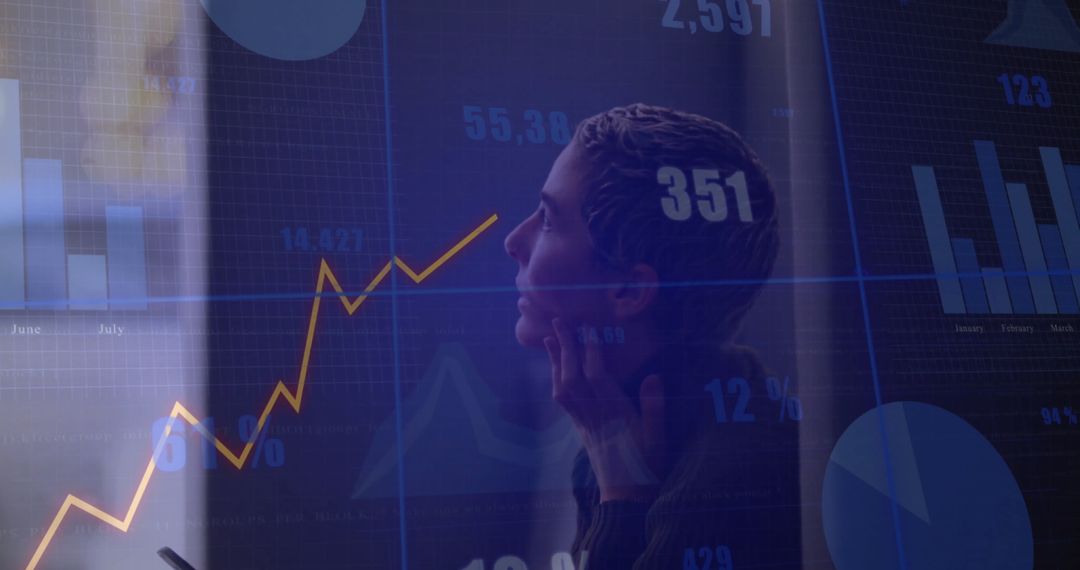
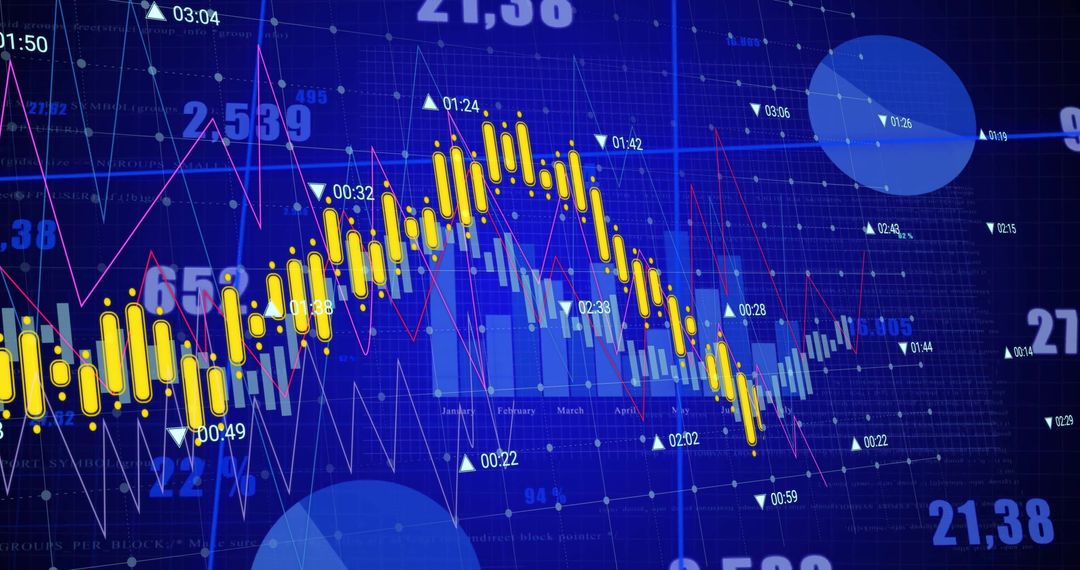
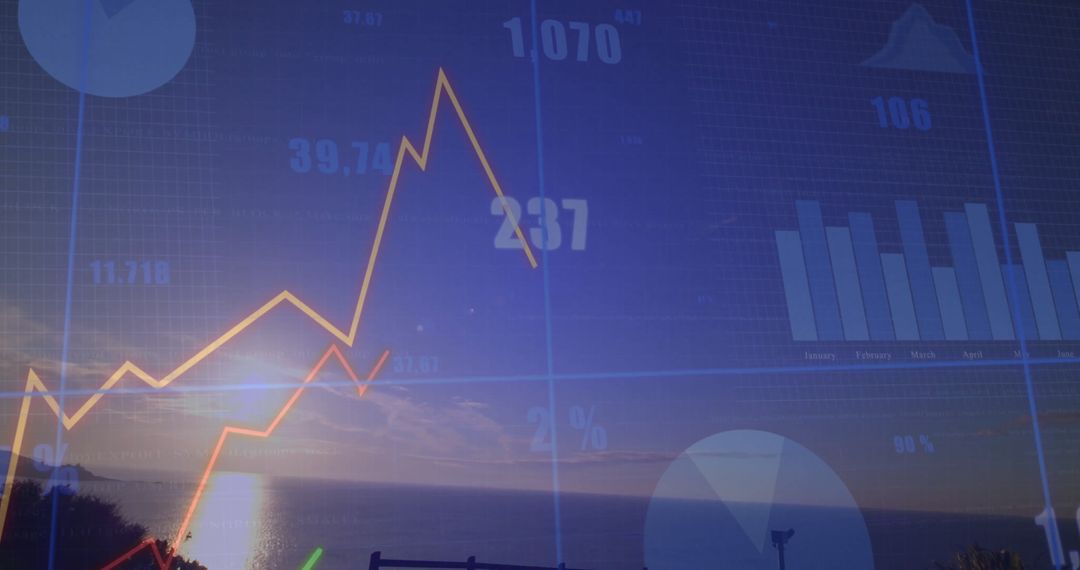
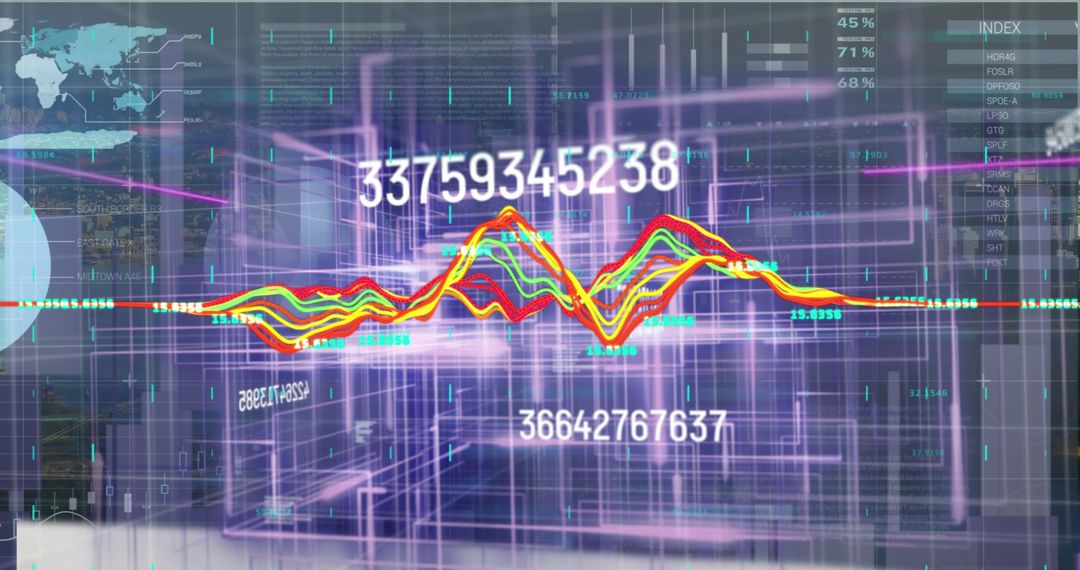
- Digital Finance Dashboard with Market Trend Analytics in Office
Digital Finance Dashboard with Market Trend Analytics in Office Image

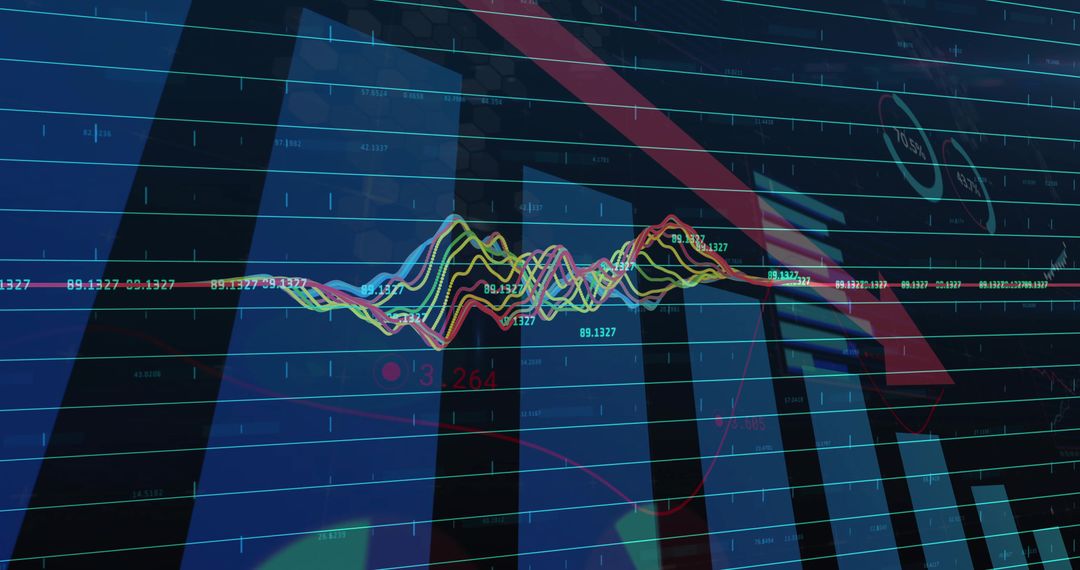
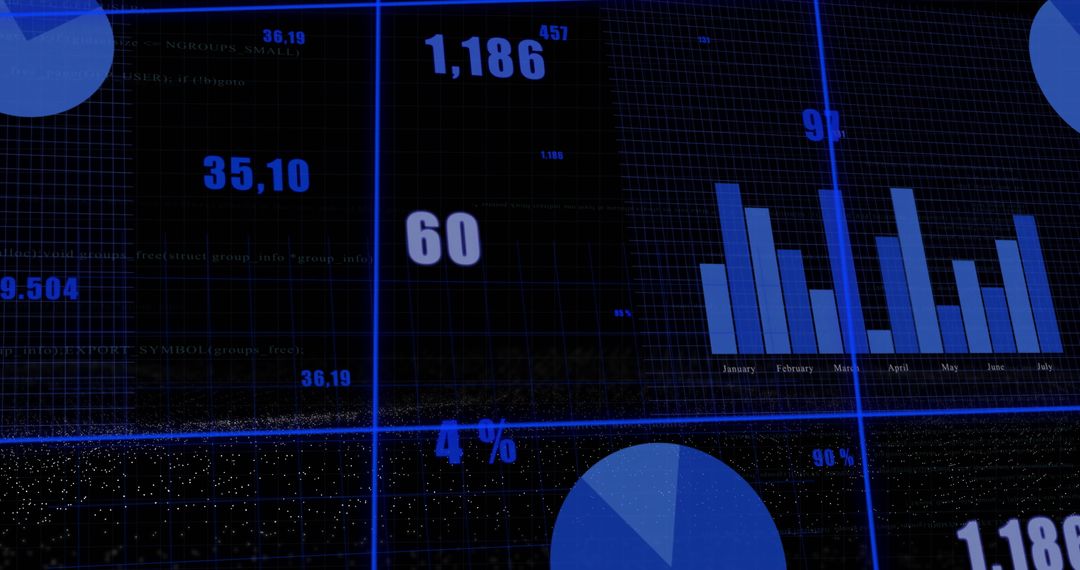
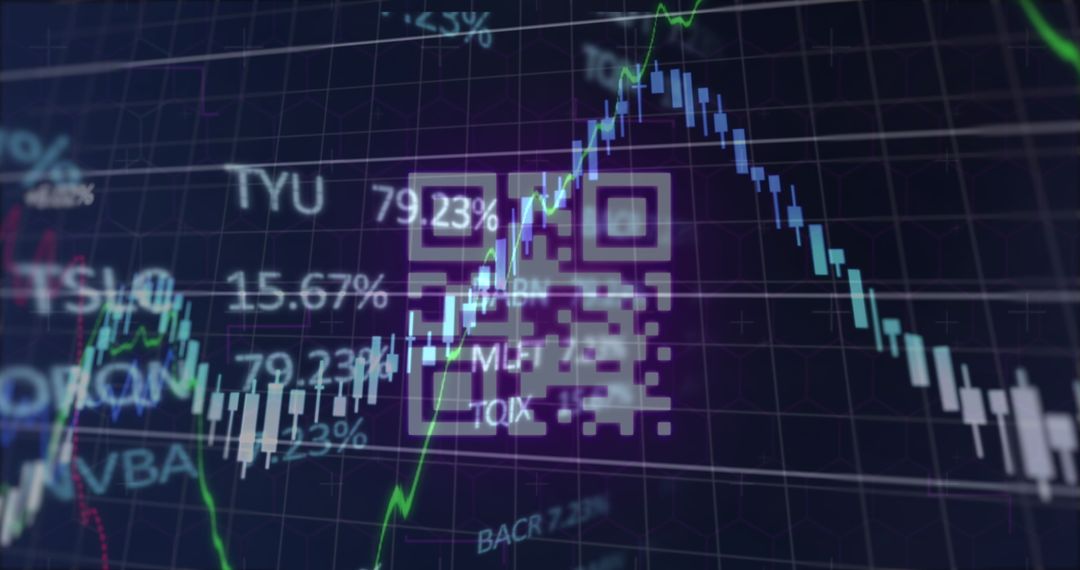
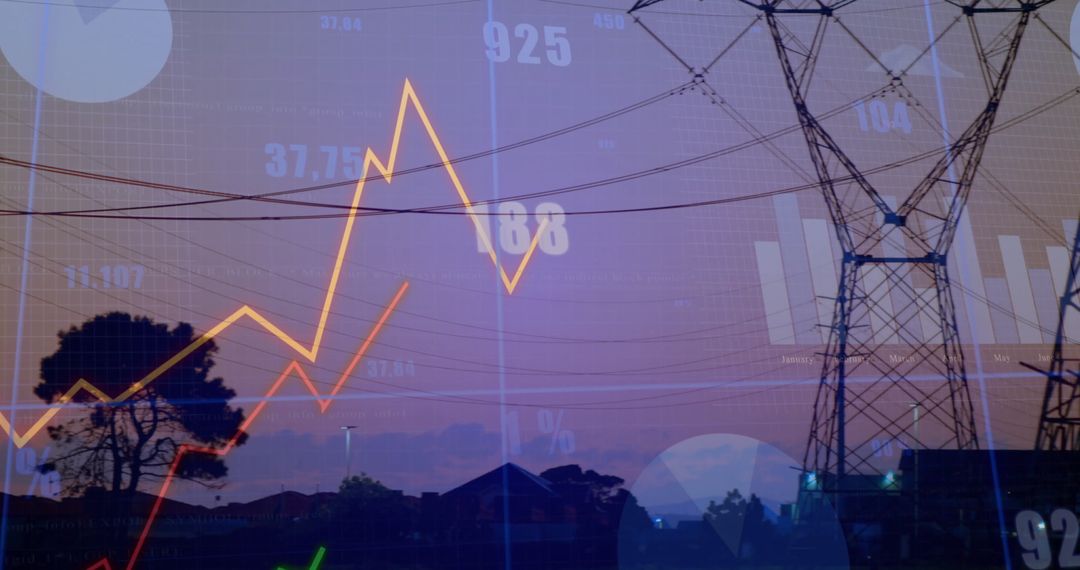
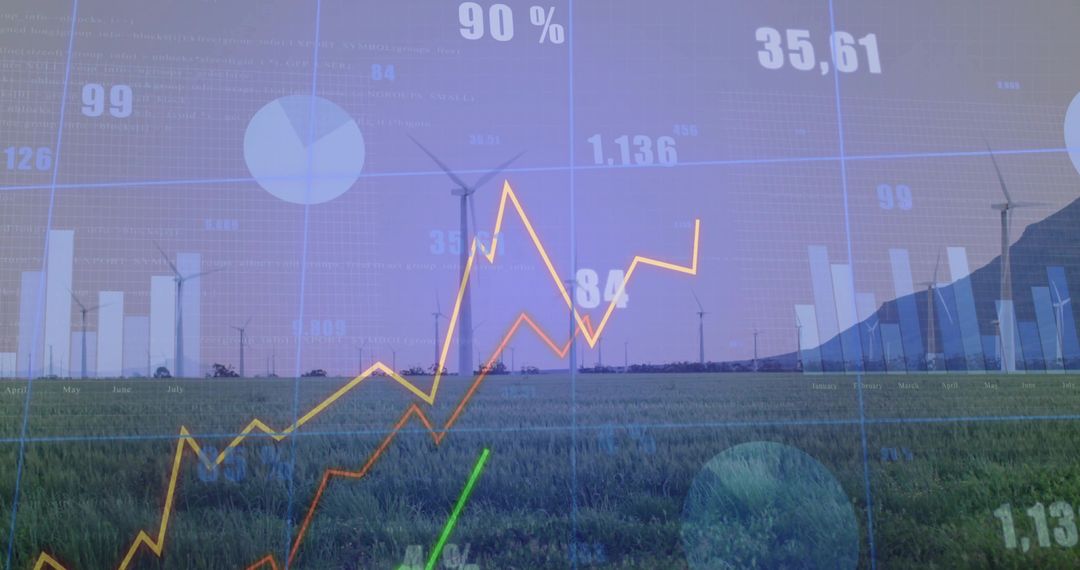
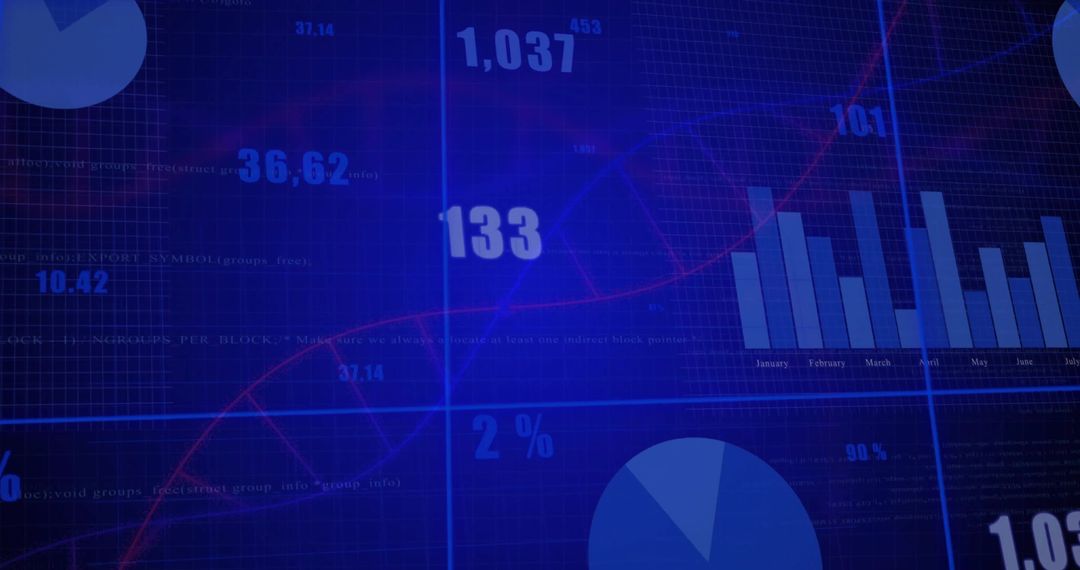
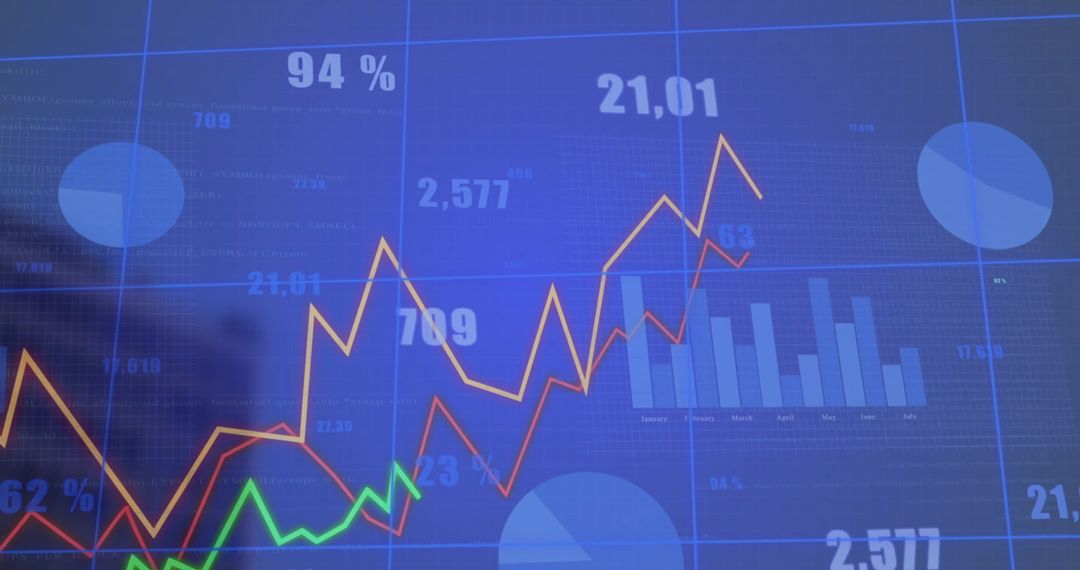
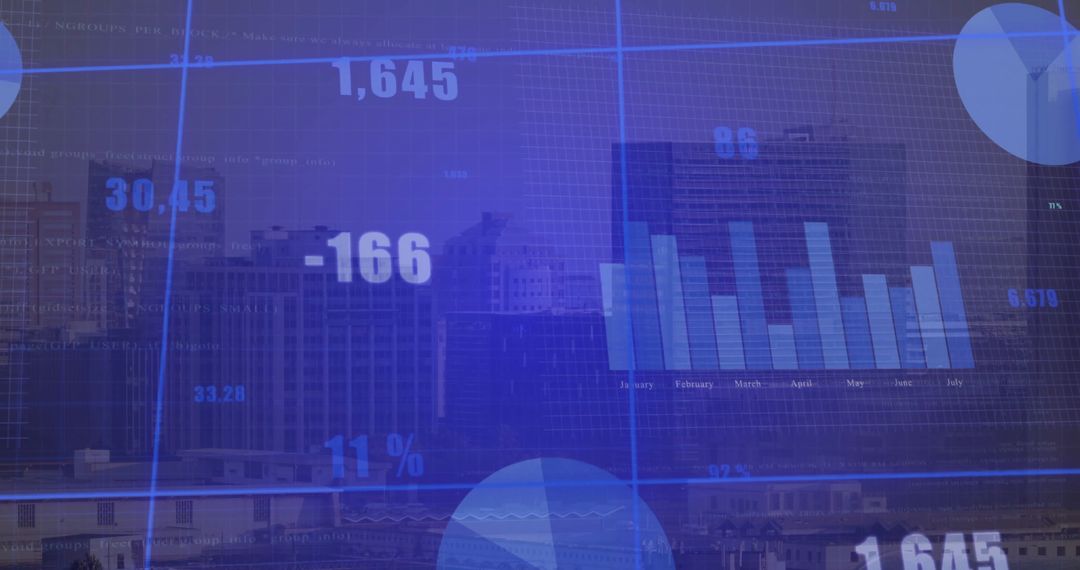
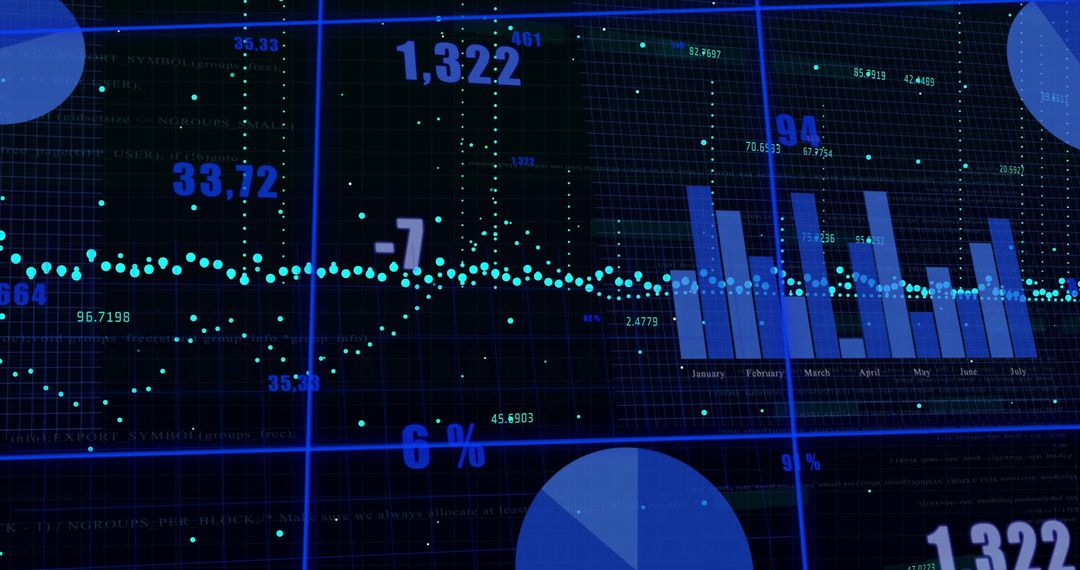
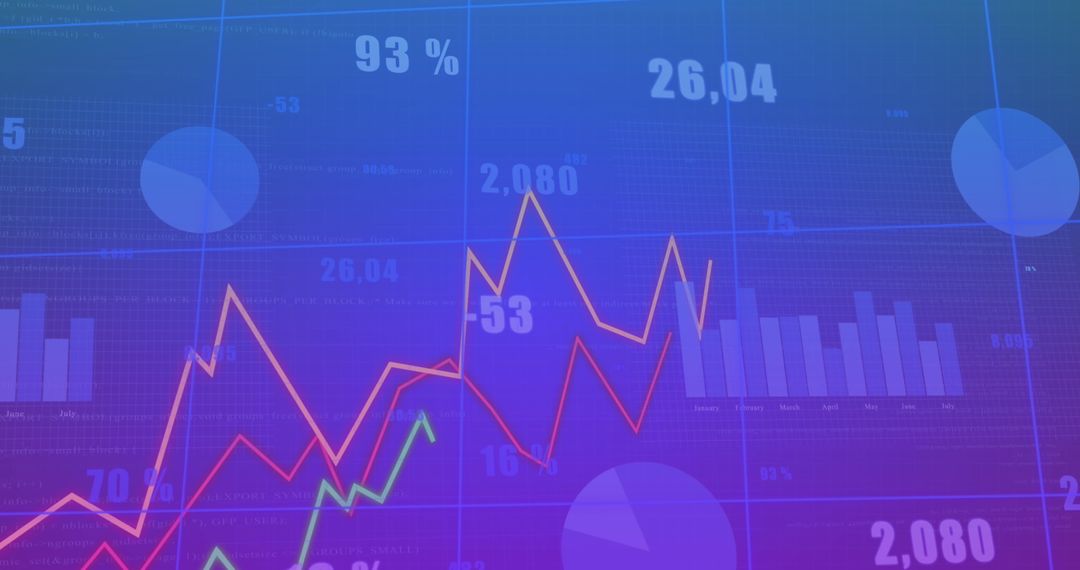
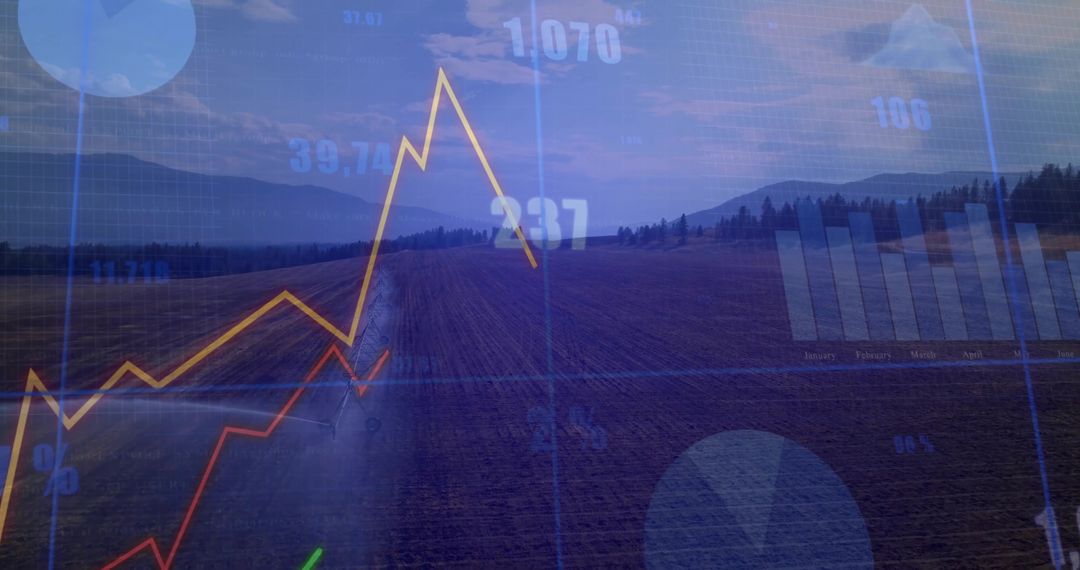
This image showcases a dynamic digital finance dashboard, blending various analytic charts including line, bar, and pie charts. It captures the essence of financial analysis and market trends in a modern office environment, highlighting technology's role in finance. Ideal for illustrating concepts related to investment strategies, financial planning, data interpretation, or technological advancements in financial services. Perfect for use in reports, presentations, or articles focusing on economic trends and analytics.
Powered by  - Get 15% off with code: PIKWIZARD15


0
downloads
downloads
Tags:
More
Credit Photo
If you would like to credit the Photo, here are some ways you can do so
Text Link
photo Link
<span class="text-link">
<span>
<a target="_blank" href=https://pikwizard.com/photo/digital-finance-dashboard-with-market-trend-analytics-in-office/9a5184e67be42e0d72ef3899ed036623/>PikWizard</a>
</span>
</span>
<span class="image-link">
<span
style="margin: 0 0 20px 0; display: inline-block; vertical-align: middle; width: 100%;"
>
<a
target="_blank"
href="https://pikwizard.com/photo/digital-finance-dashboard-with-market-trend-analytics-in-office/9a5184e67be42e0d72ef3899ed036623/"
style="text-decoration: none; font-size: 10px; margin: 0;"
>
<img src="https://pikwizard.com/pw/medium/9a5184e67be42e0d72ef3899ed036623.jpg" style="margin: 0; width: 100%;" alt="" />
<p style="font-size: 12px; margin: 0;">PikWizard</p>
</a>
</span>
</span>
Free (free of charge)
Free for personal and commercial use.
Author: Creative Art
Similar Free Stock Images

Premium


Premium


Premium


Premium


Premium


Premium


Premium


Premium


Premium


Premium


Premium


Premium


Premium


Premium


Premium


Premium


Premium


Premium


Premium


Premium


Premium


Premium


Premium


Premium


Premium