- Home >
- Stock Photos >
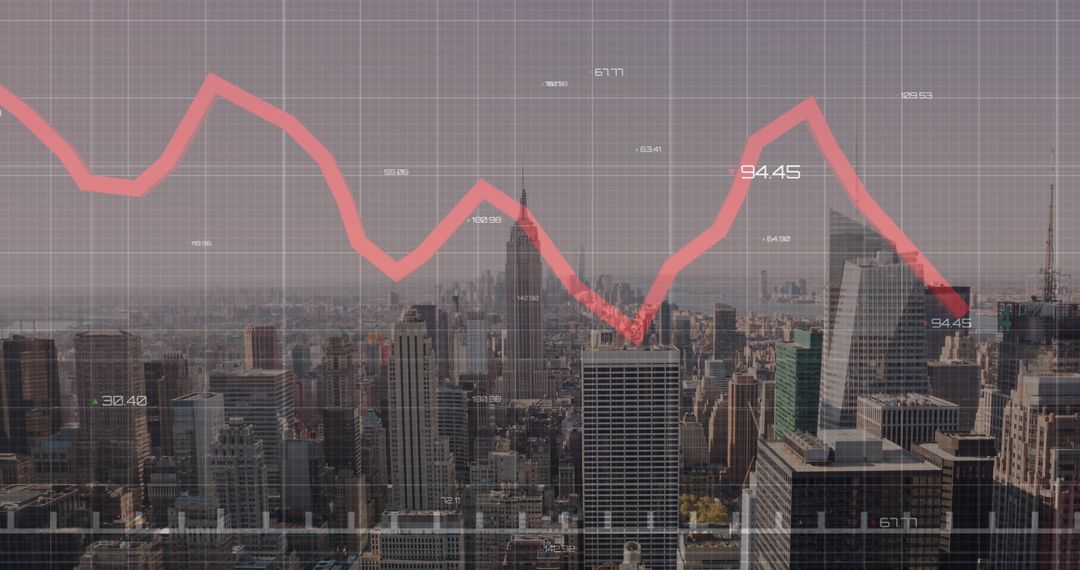
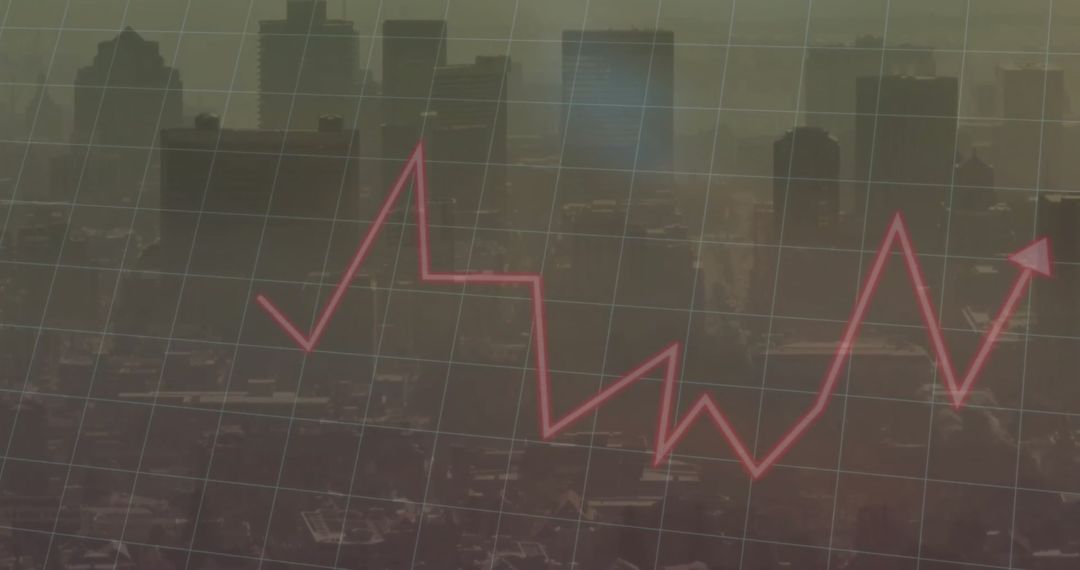
- Digital Finance Graph Over Urban Skyline
Digital Finance Graph Over Urban Skyline Image

Image showcases digital graph overlaying cityscape, symbolizing global finance, economic trends, and investment opportunities. Ideal for topics related to financial blogging, investment strategies, technological advancements in finance, stock market analysis, or corporate websites emphasizing financial growth.
Powered by 


4
downloads
downloads
Tags:
More
Credit Photo
If you would like to credit the Photo, here are some ways you can do so
Text Link
photo Link
<span class="text-link">
<span>
<a target="_blank" href=https://pikwizard.com/photo/digital-finance-graph-over-urban-skyline/dbf2f1ff91a87bee1fd598d2ec67440e/>PikWizard</a>
</span>
</span>
<span class="image-link">
<span
style="margin: 0 0 20px 0; display: inline-block; vertical-align: middle; width: 100%;"
>
<a
target="_blank"
href="https://pikwizard.com/photo/digital-finance-graph-over-urban-skyline/dbf2f1ff91a87bee1fd598d2ec67440e/"
style="text-decoration: none; font-size: 10px; margin: 0;"
>
<img src="https://pikwizard.com/pw/medium/dbf2f1ff91a87bee1fd598d2ec67440e.jpg" style="margin: 0; width: 100%;" alt="" />
<p style="font-size: 12px; margin: 0;">PikWizard</p>
</a>
</span>
</span>
Free (free of charge)
Free for personal and commercial use.
Author: People Creations
Similar Free Stock Images

Premium


Premium


Premium


Premium


Premium


Premium


Premium


Premium


Premium


Premium


Premium


Premium


Premium


Premium


Premium


Premium


Premium


Premium


Premium


Premium


Premium


Premium


Premium


Premium