- Home >
- Stock Photos >
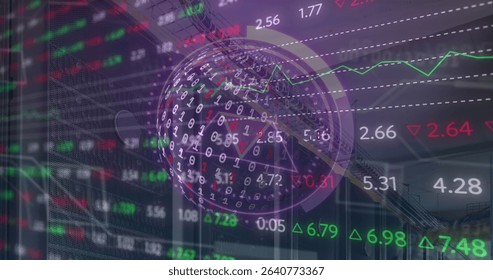
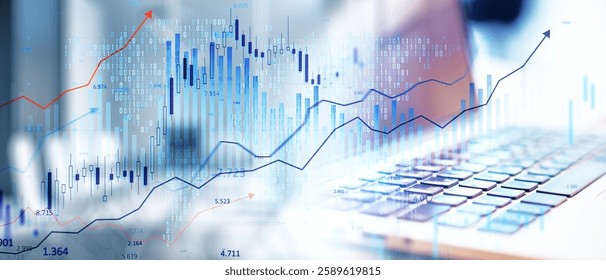
- Digital Finance: Holographic Trading and Tech Visualization
Digital Finance: Holographic Trading and Tech Visualization Image

Depicts an interplay between trading data, graphs, and binary code within an abstract technology setting. Ideal for illustrating modern financial and technological themes, presentations on stock market trends, business reports, or articles exploring the fusion of finance and technology in the digital age.
Powered by  - Get 15% off with code: PIKWIZARD15


2
downloads
downloads
Tags:
More
Credit Photo
If you would like to credit the Photo, here are some ways you can do so
Text Link
photo Link
<span class="text-link">
<span>
<a target="_blank" href=https://pikwizard.com/photo/digital-finance-holographic-trading-and-tech-visualization/9c88aed53fe36ba8430308c864b329f0/>PikWizard</a>
</span>
</span>
<span class="image-link">
<span
style="margin: 0 0 20px 0; display: inline-block; vertical-align: middle; width: 100%;"
>
<a
target="_blank"
href="https://pikwizard.com/photo/digital-finance-holographic-trading-and-tech-visualization/9c88aed53fe36ba8430308c864b329f0/"
style="text-decoration: none; font-size: 10px; margin: 0;"
>
<img src="https://pikwizard.com/pw/medium/9c88aed53fe36ba8430308c864b329f0.jpg" style="margin: 0; width: 100%;" alt="" />
<p style="font-size: 12px; margin: 0;">PikWizard</p>
</a>
</span>
</span>
Free (free of charge)
Free for personal and commercial use.
Author: Awesome Content
Similar Free Stock Images

Premium


Premium


Premium


Premium


Premium


Premium


Premium


Premium


Premium


Premium


Premium


Premium


Premium


Premium


Premium


Premium


Premium


Premium


Premium


Premium


Premium


Premium


Premium


Premium