
- Home >
- Stock Photos >
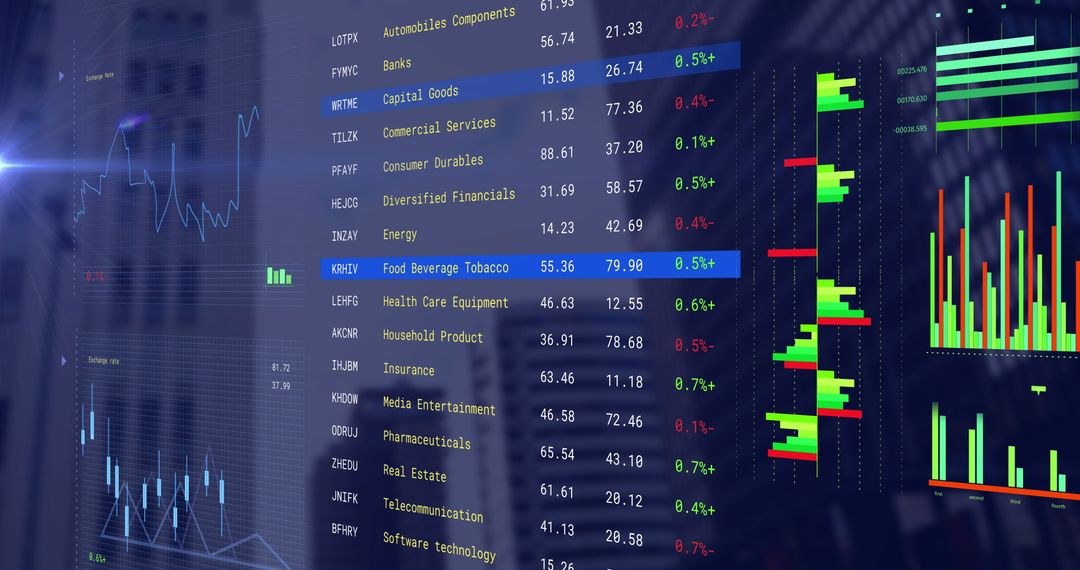
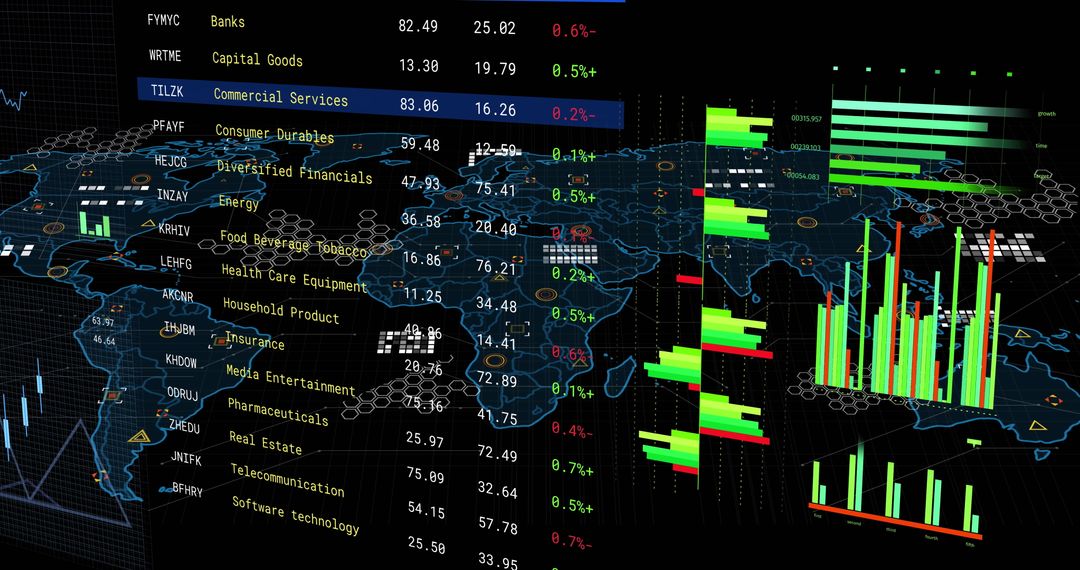
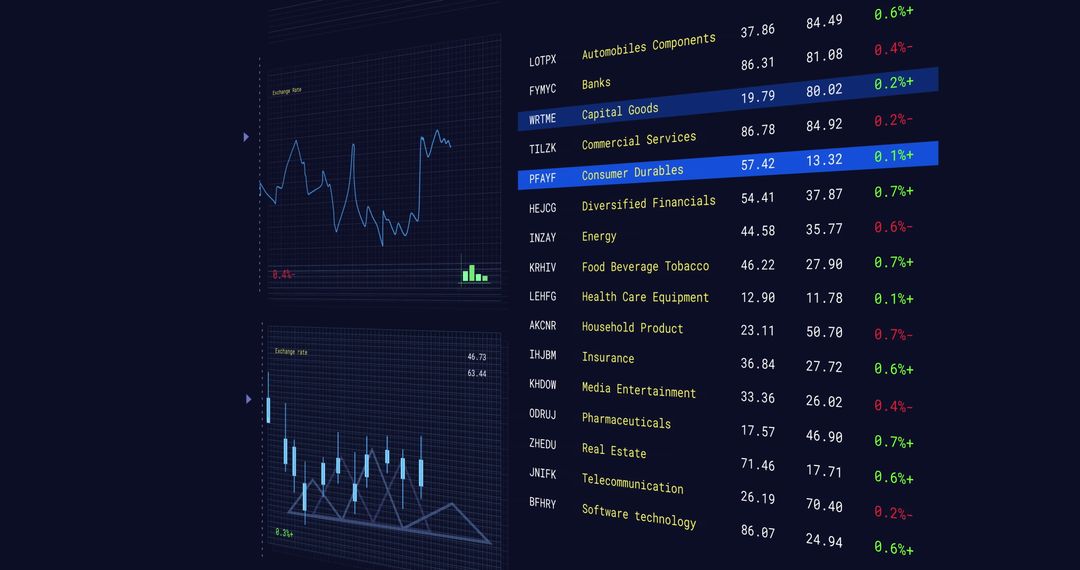
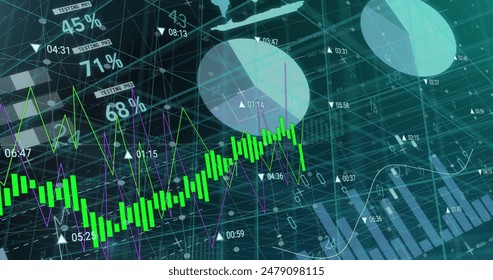
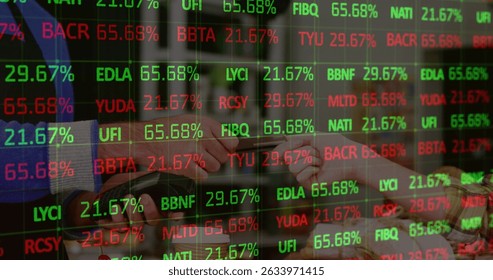
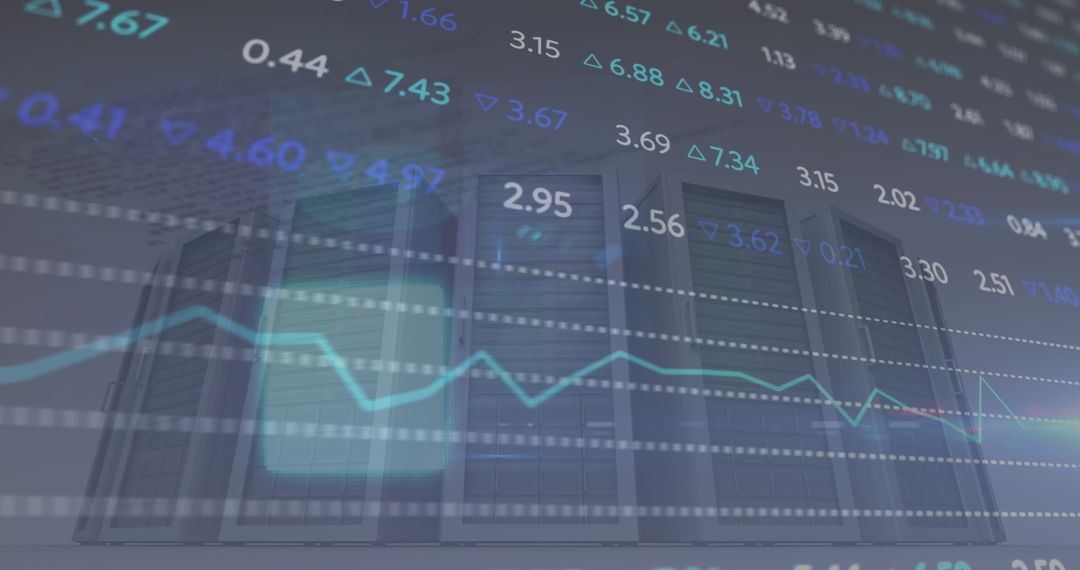
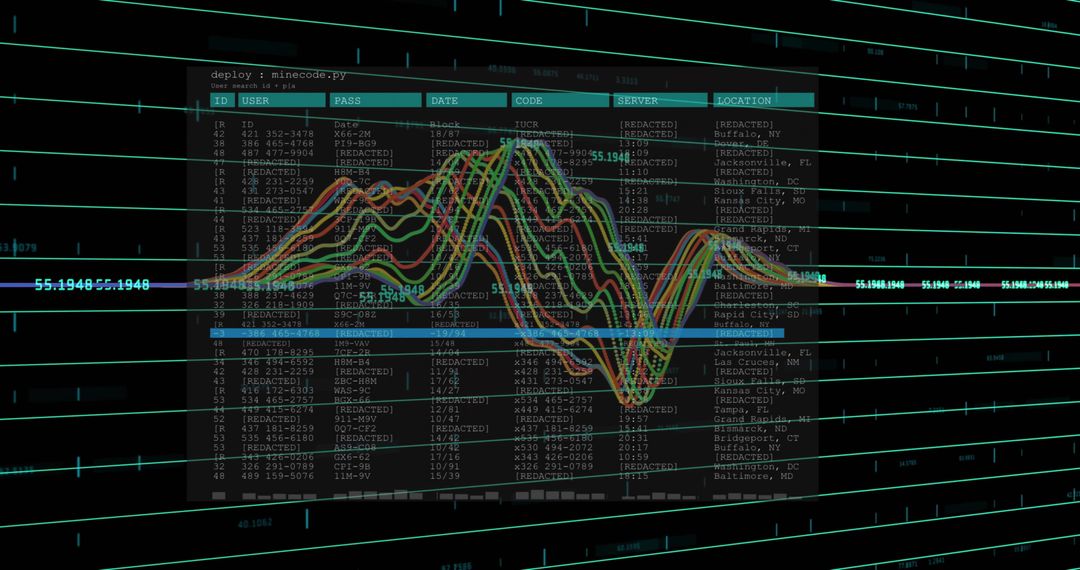
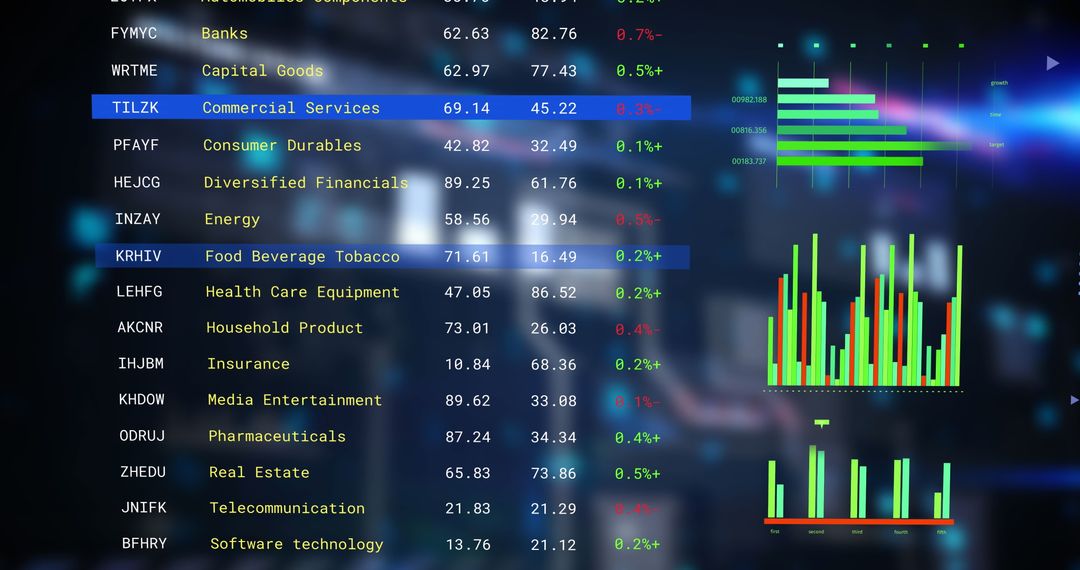
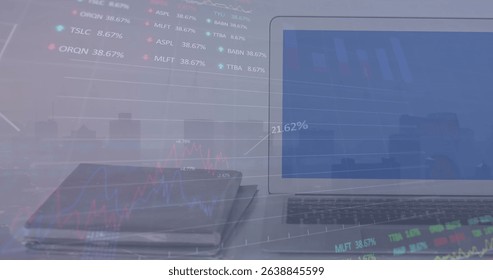
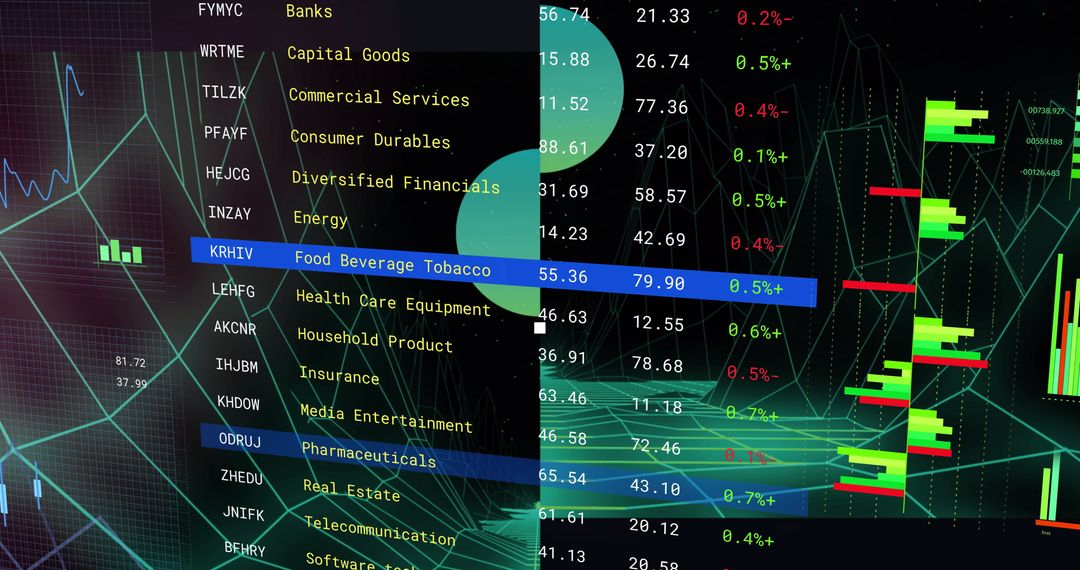
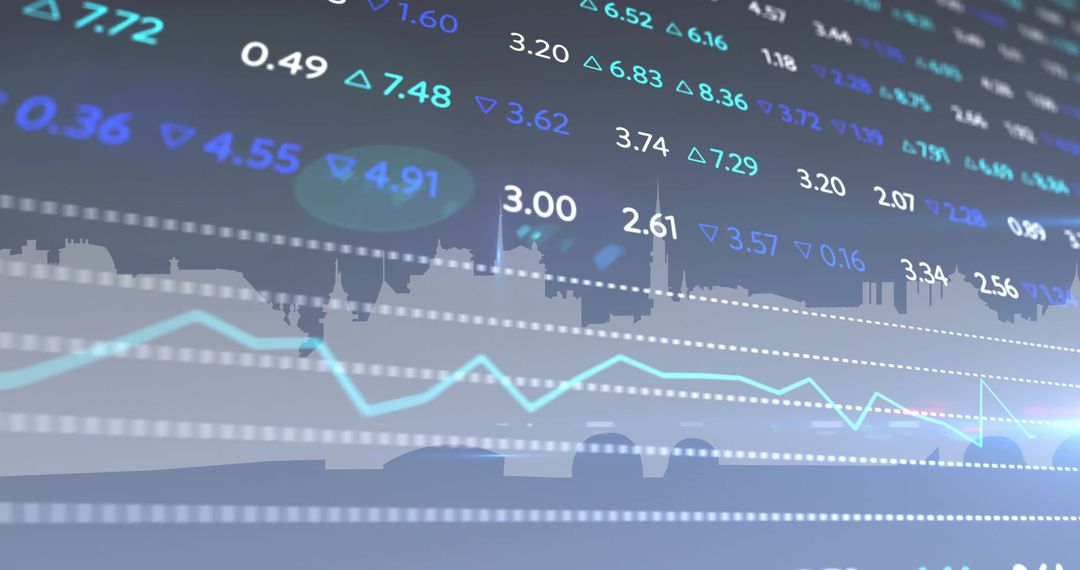
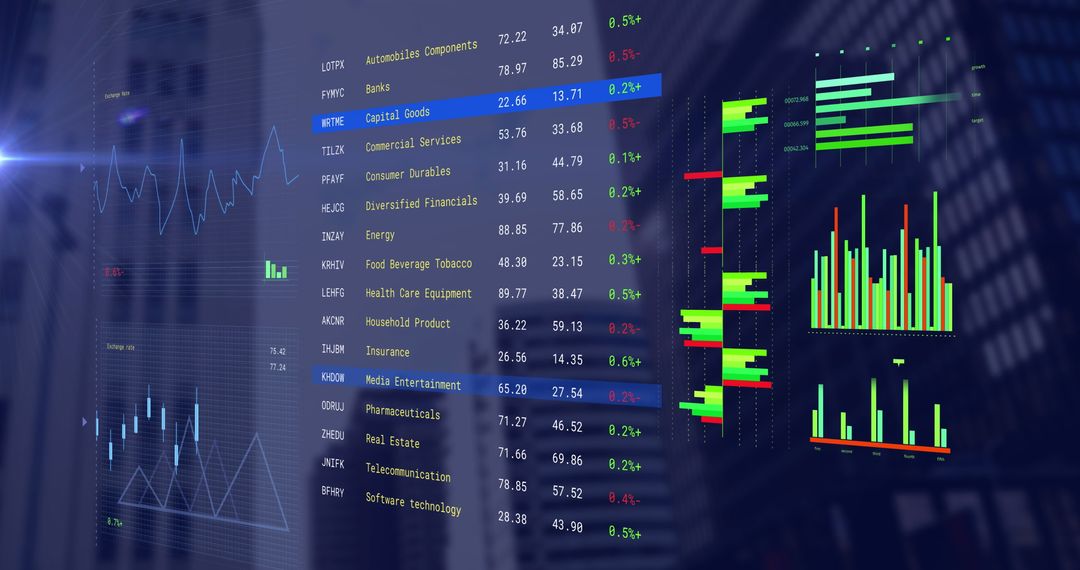
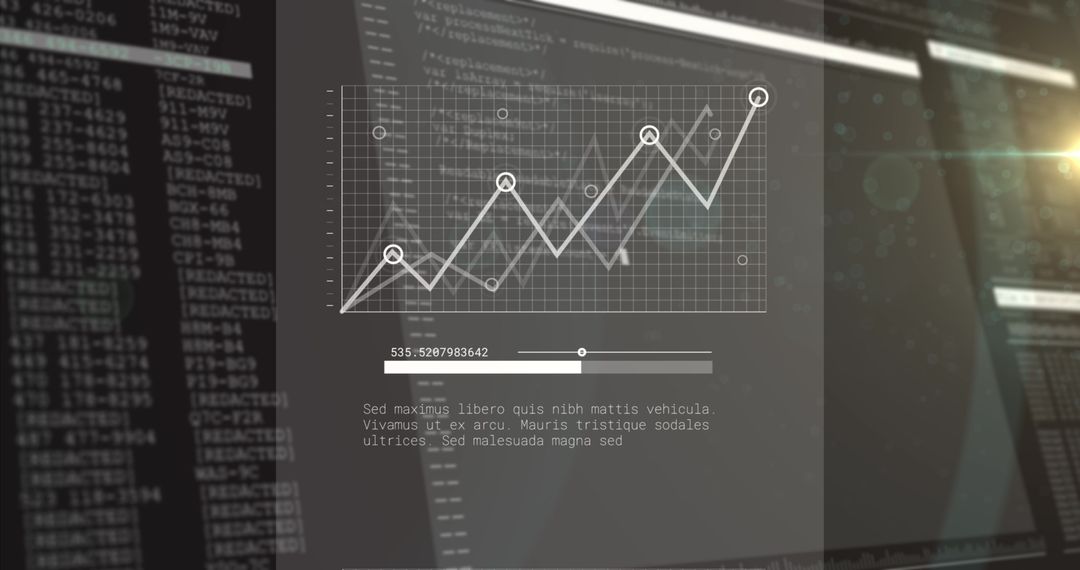
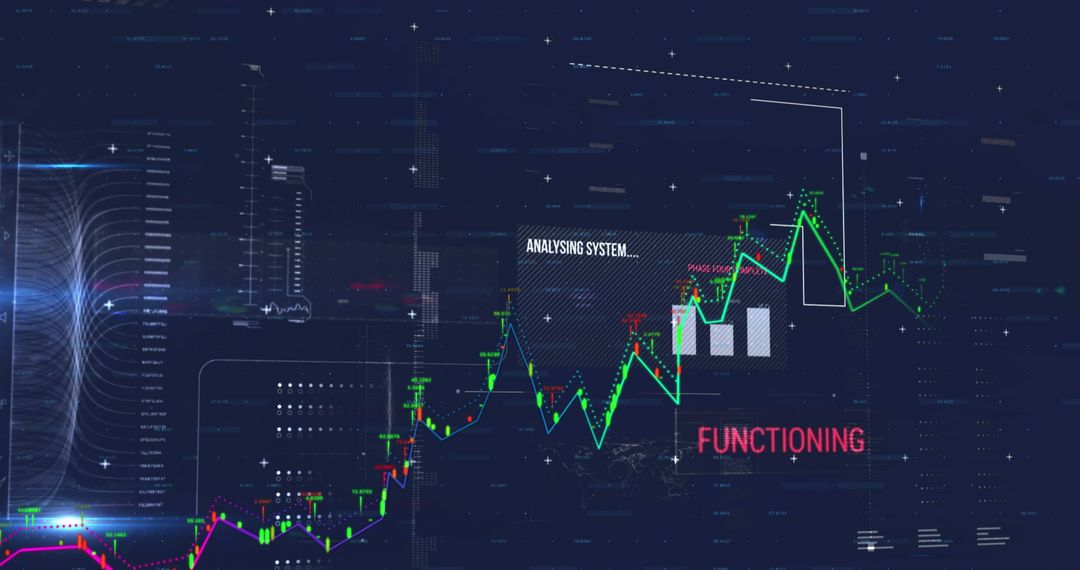
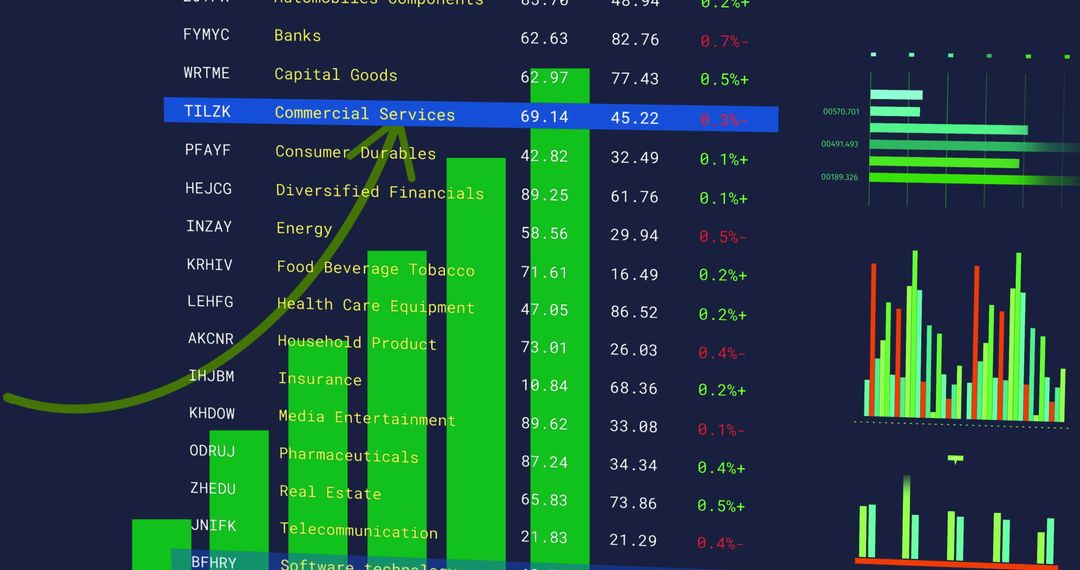
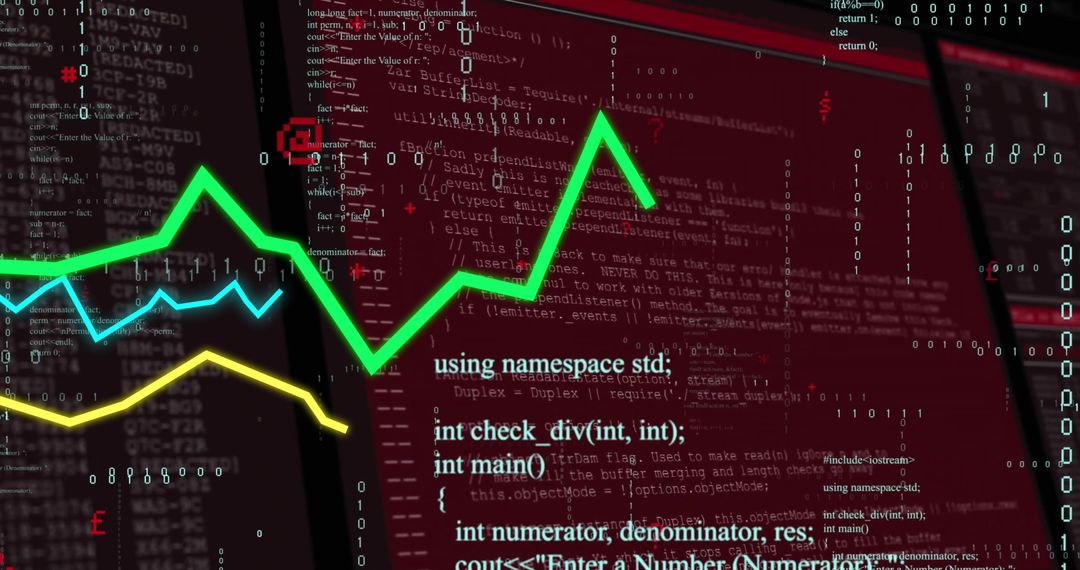
- Digital Financial Analysis with Real-Time Stock Market Data
Digital Financial Analysis with Real-Time Stock Market Data Image

Scene shows detailed stock market analysis with various graphs and charts, focusing on financial and economic data. Useful for presentations on investment strategies, financial forecasts, or economic studies.
Powered by  - Get 15% off with code: PIKWIZARD15


2
downloads
downloads
Tags:
More
Credit Photo
If you would like to credit the Photo, here are some ways you can do so
Text Link
photo Link
<span class="text-link">
<span>
<a target="_blank" href=https://pikwizard.com/photo/digital-financial-analysis-with-real-time-stock-market-data/b467ee021811b59a4561c1cab6885bb2/>PikWizard</a>
</span>
</span>
<span class="image-link">
<span
style="margin: 0 0 20px 0; display: inline-block; vertical-align: middle; width: 100%;"
>
<a
target="_blank"
href="https://pikwizard.com/photo/digital-financial-analysis-with-real-time-stock-market-data/b467ee021811b59a4561c1cab6885bb2/"
style="text-decoration: none; font-size: 10px; margin: 0;"
>
<img src="https://pikwizard.com/pw/medium/b467ee021811b59a4561c1cab6885bb2.jpg" style="margin: 0; width: 100%;" alt="" />
<p style="font-size: 12px; margin: 0;">PikWizard</p>
</a>
</span>
</span>
Free (free of charge)
Free for personal and commercial use.
Author: Awesome Content
Similar Free Stock Images

Premium


Premium


Premium


Premium


Premium


Premium


Premium


Premium


Premium


Premium


Premium


Premium


Premium


Premium


Premium


Premium


Premium


Premium


Premium


Premium


Premium


Premium


Premium


Premium

