- Home >
- Stock Photos >
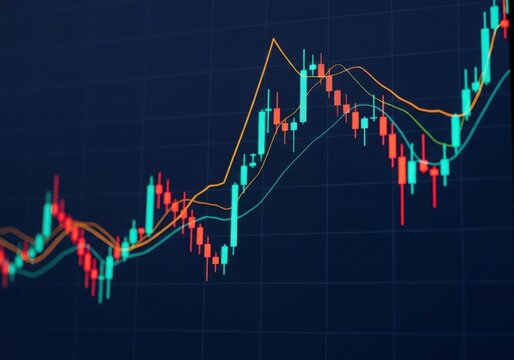
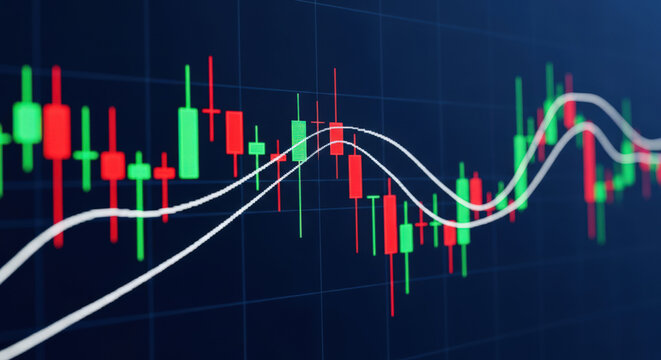
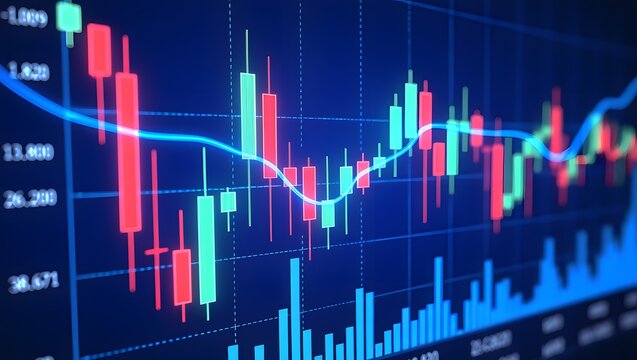
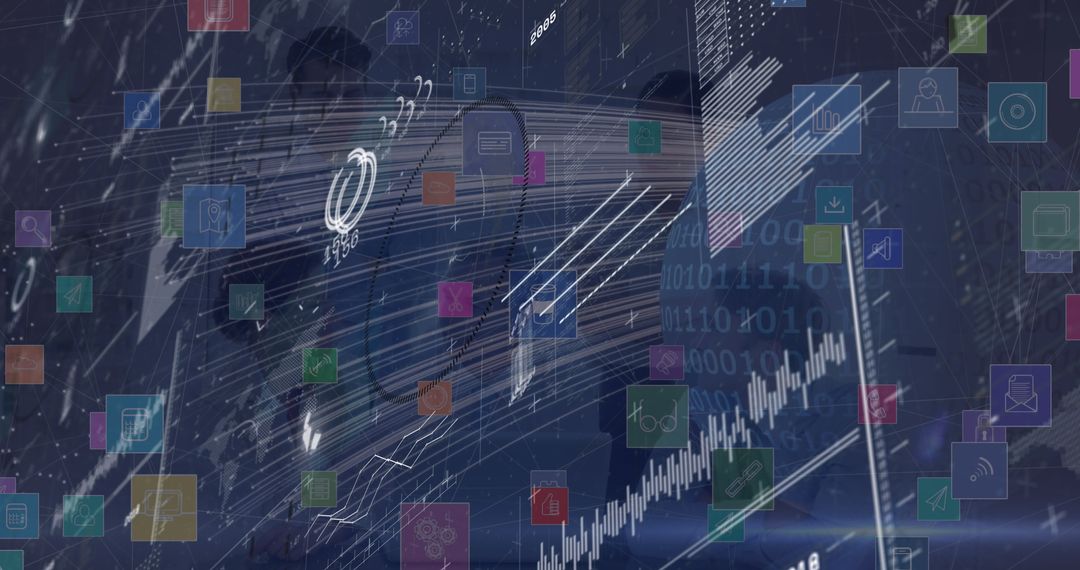
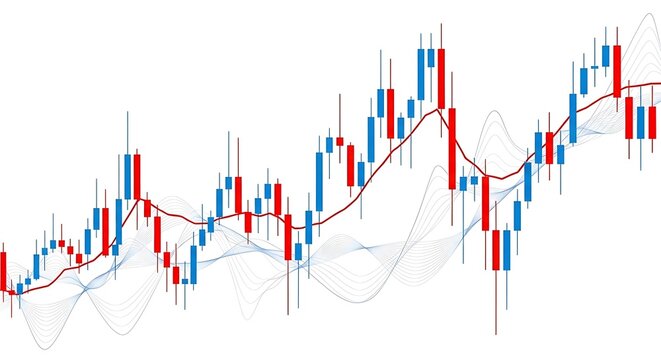
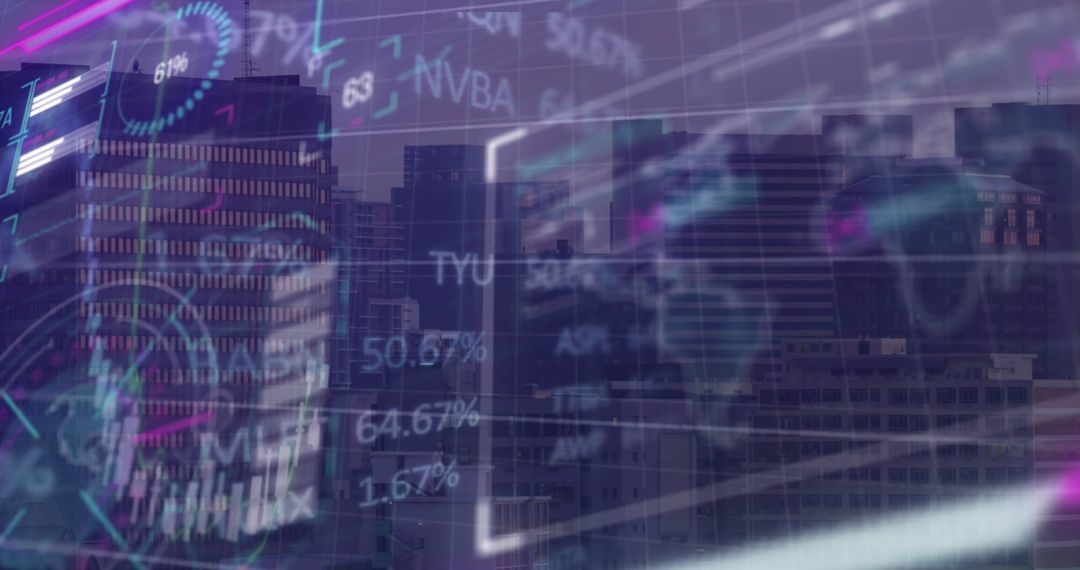
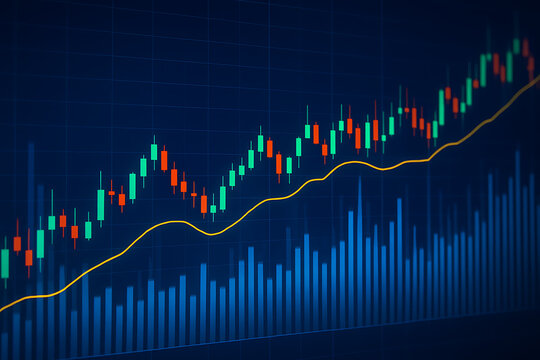
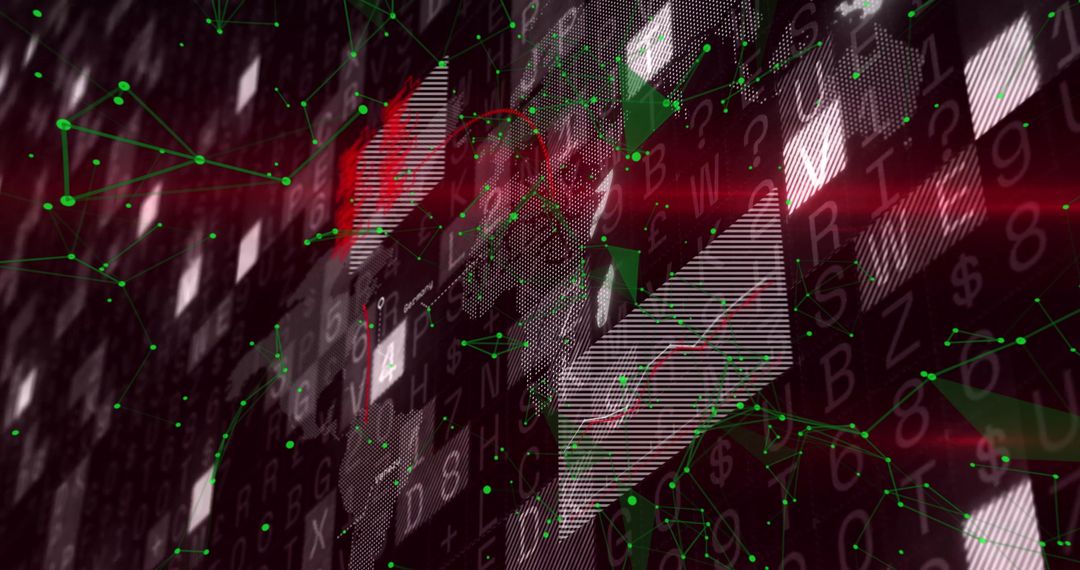
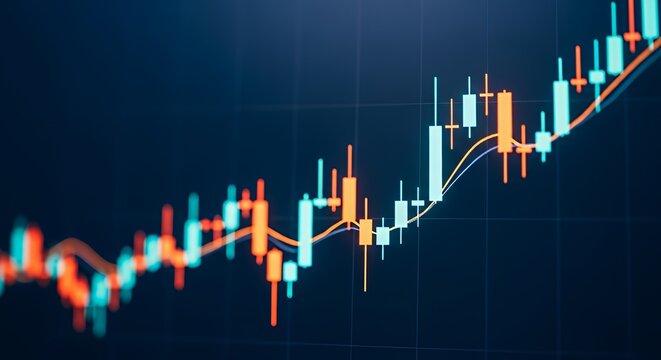
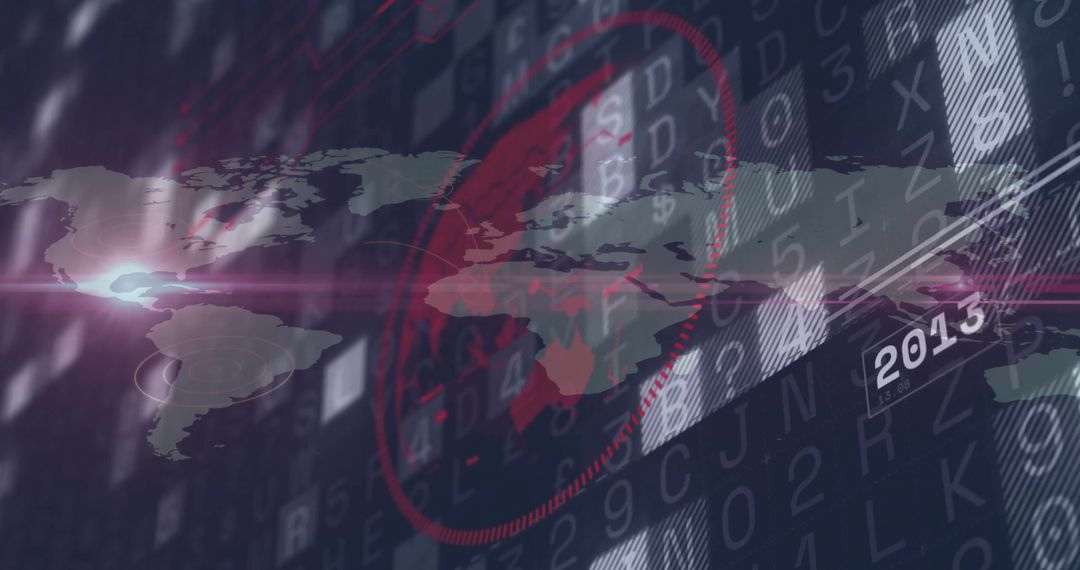
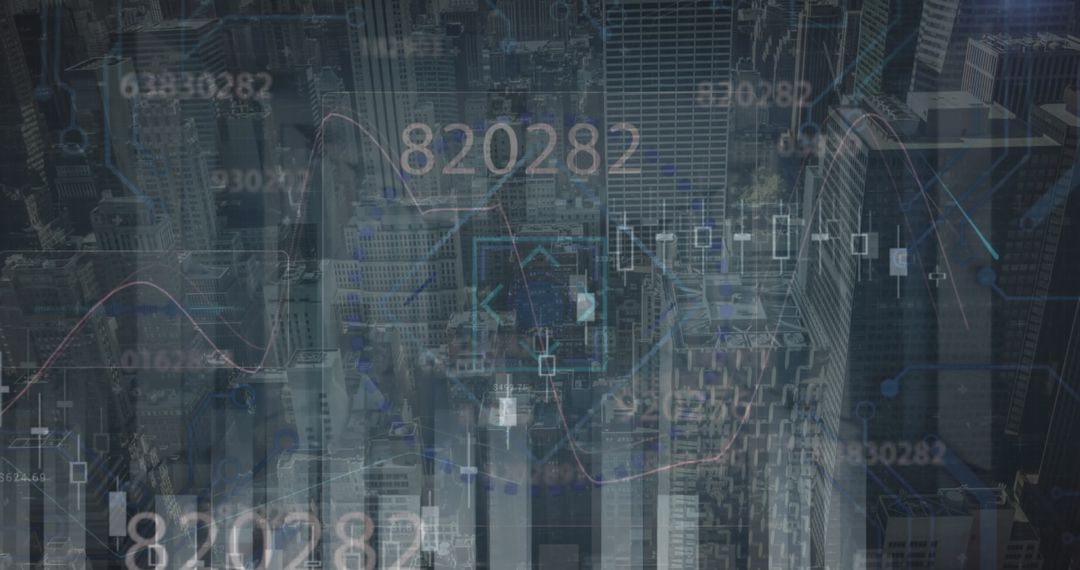
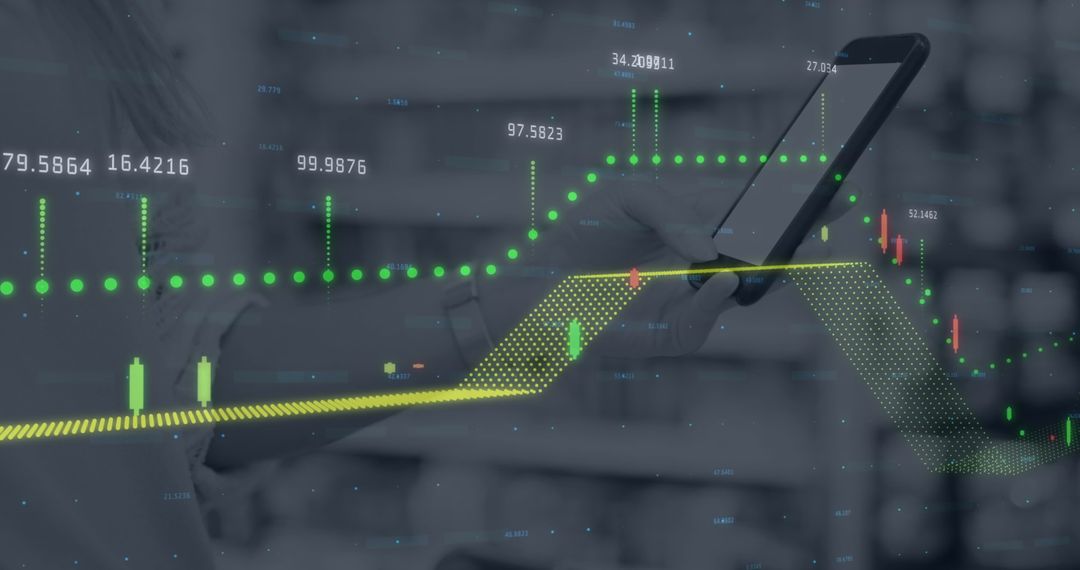
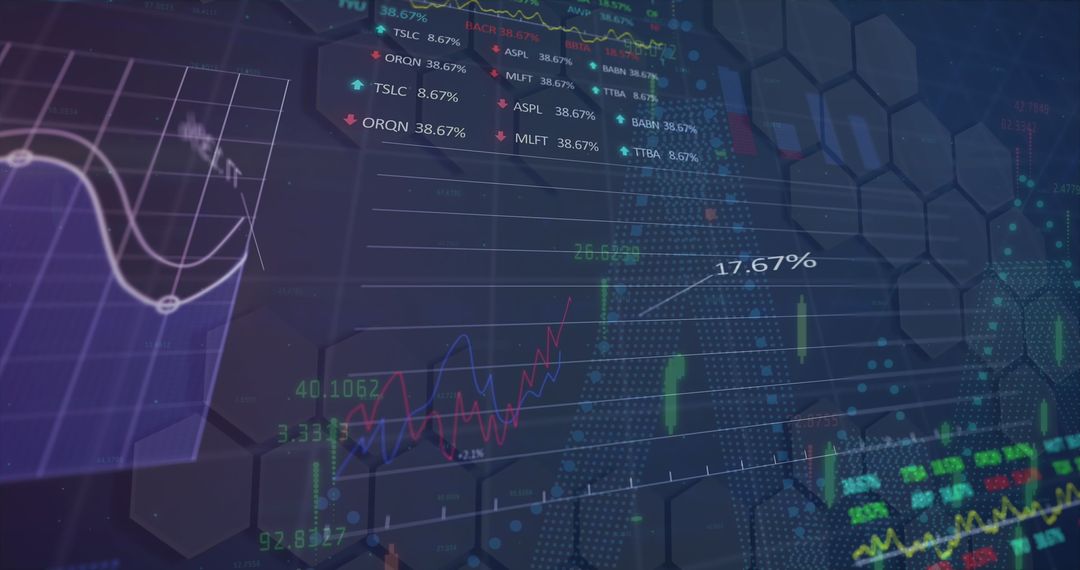
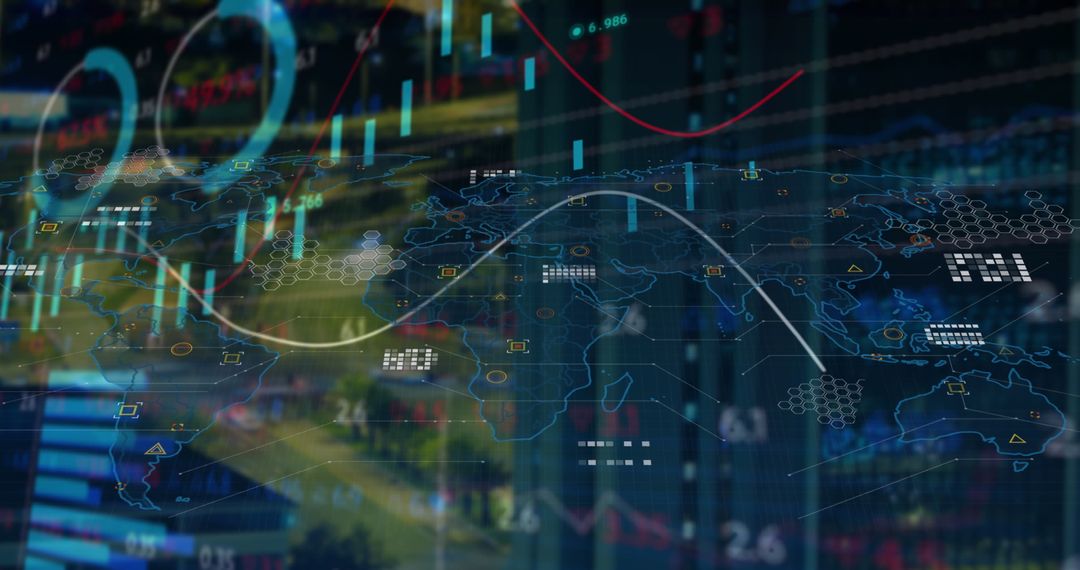
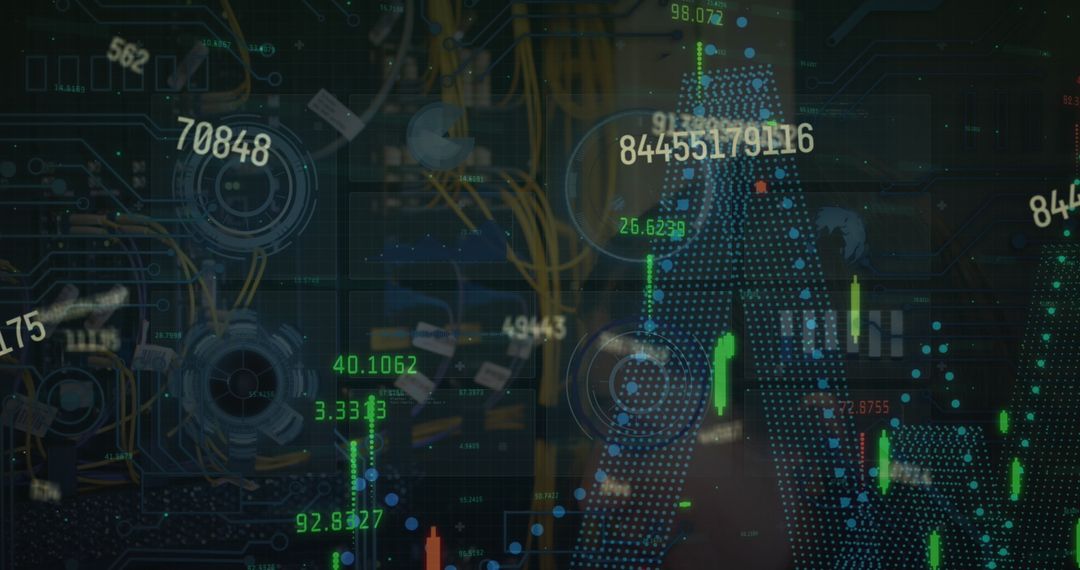
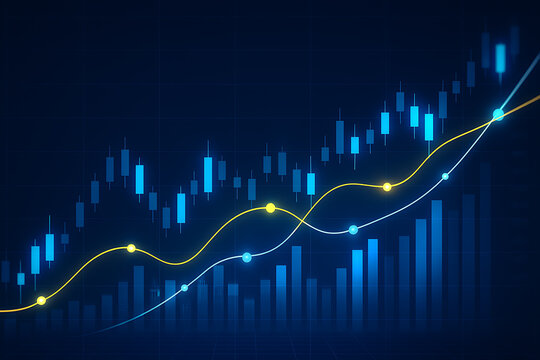
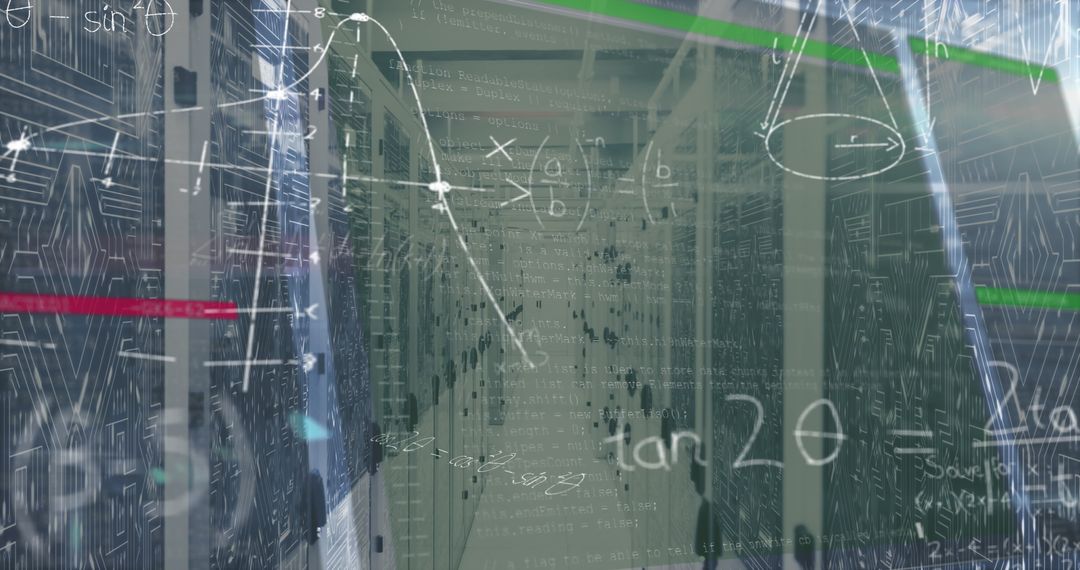
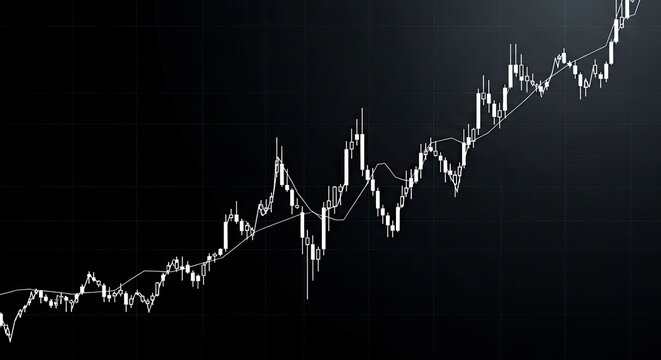
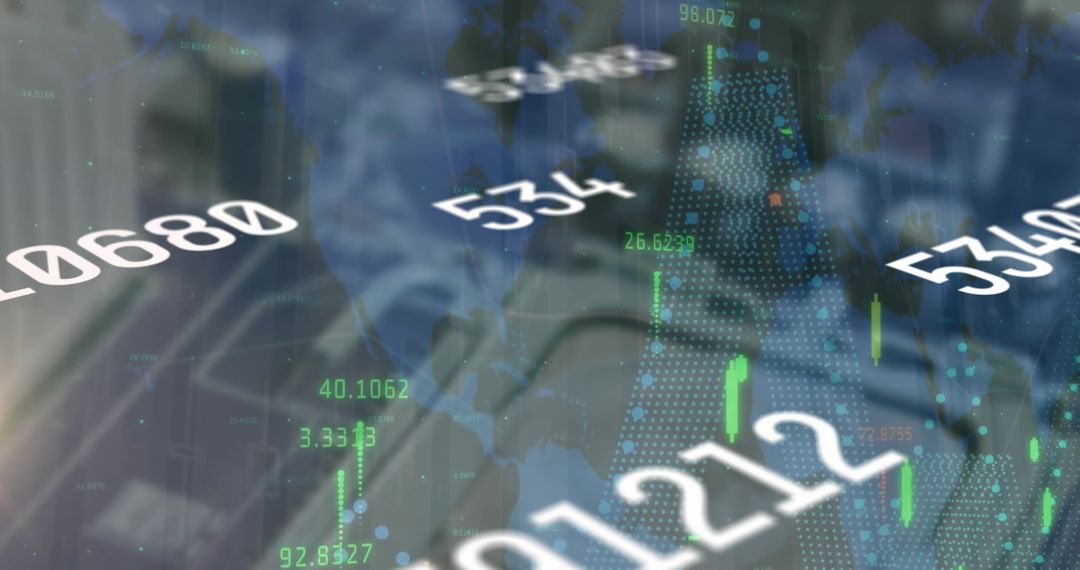
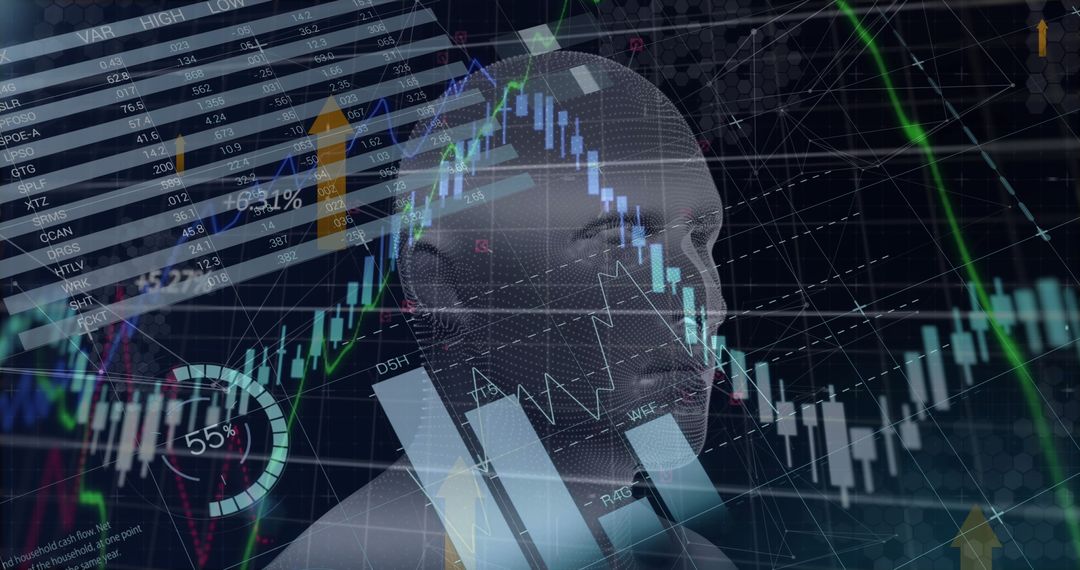
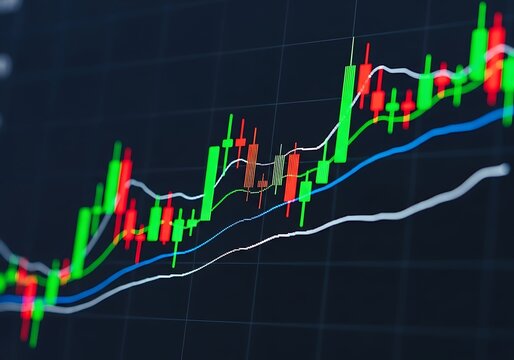
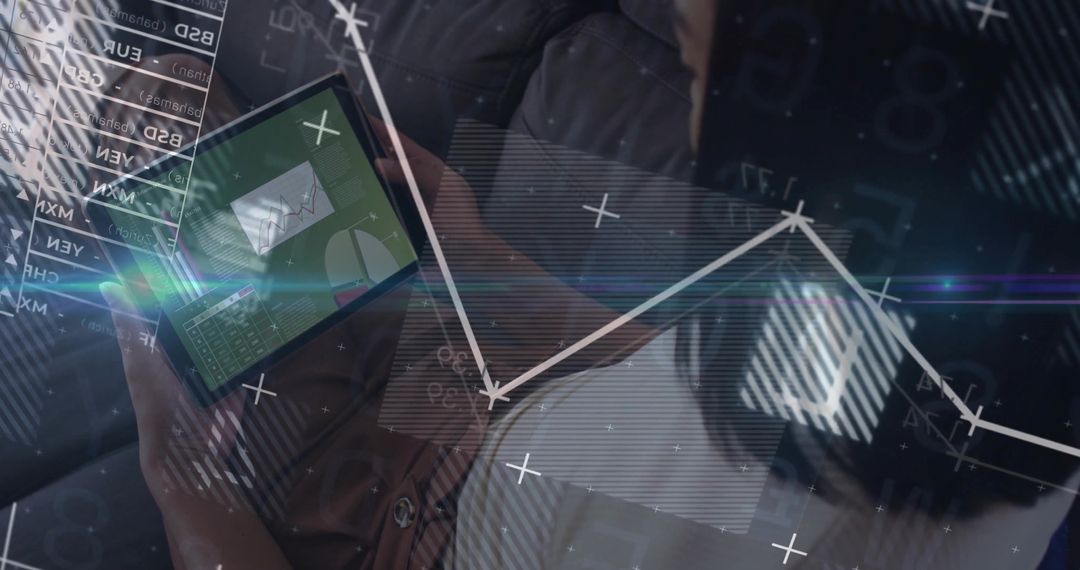
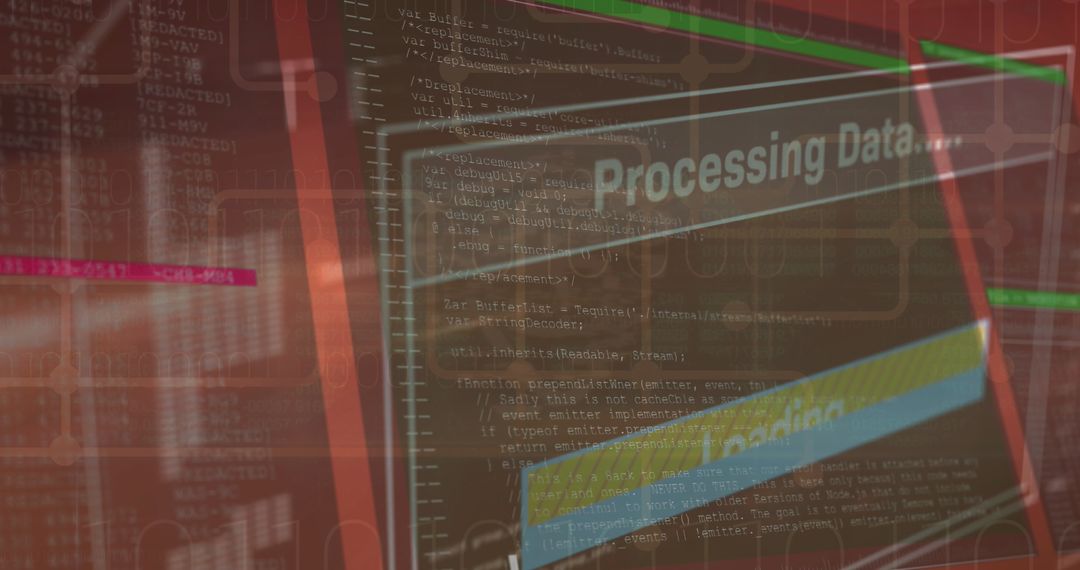
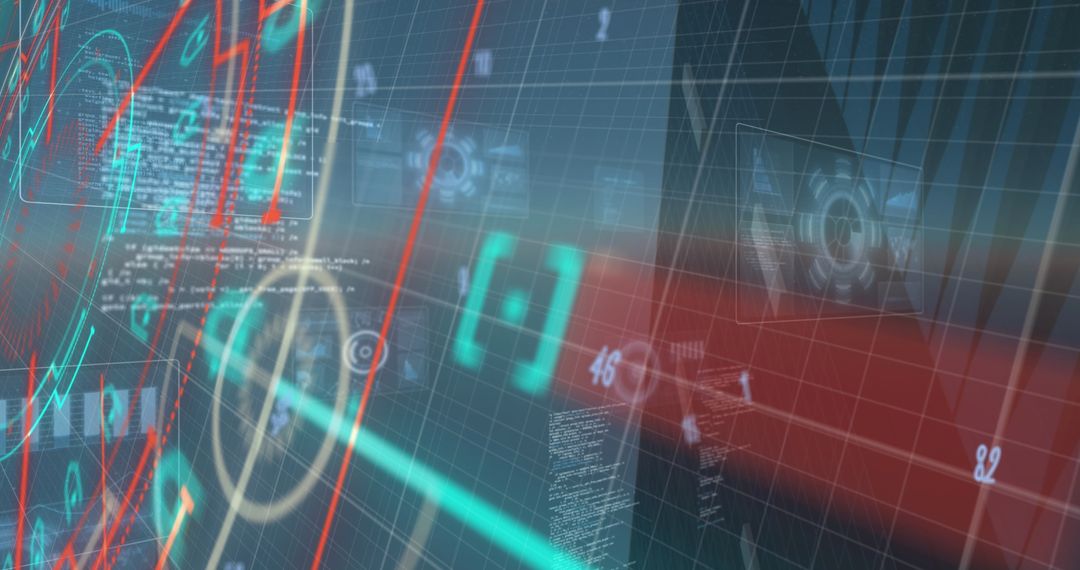
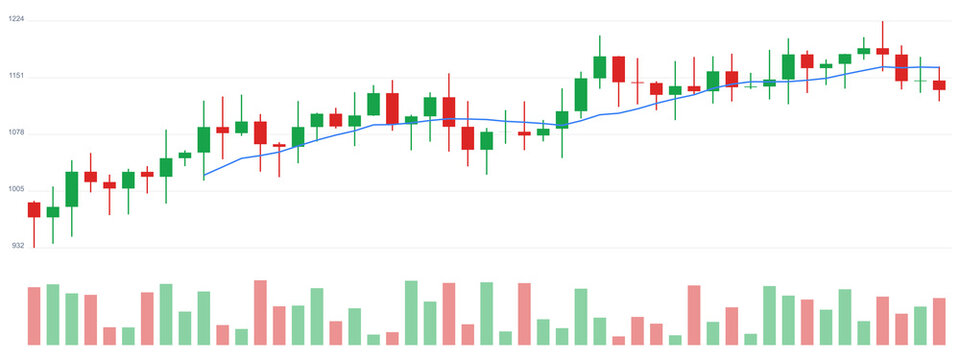
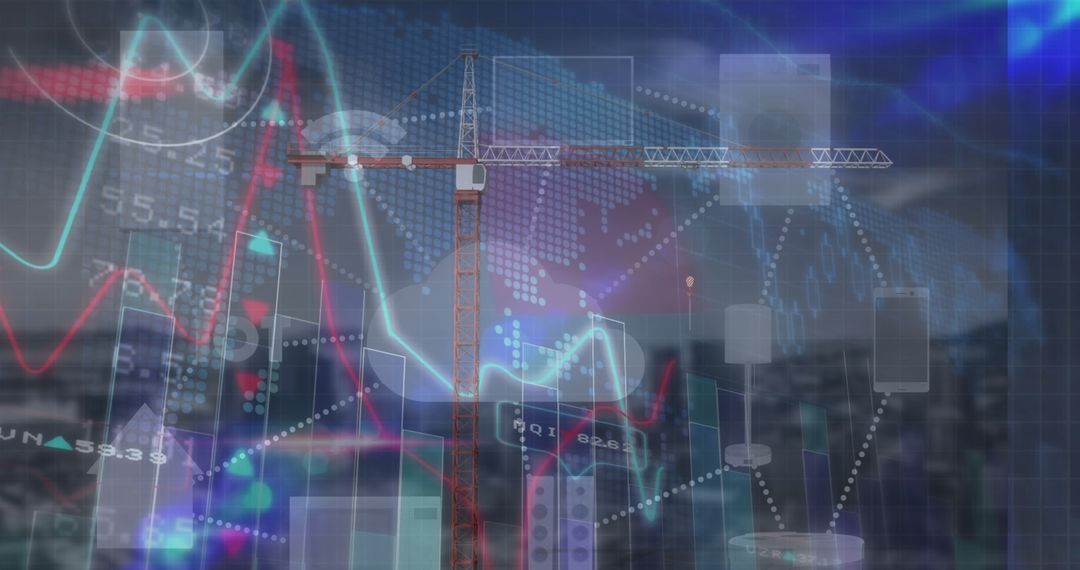
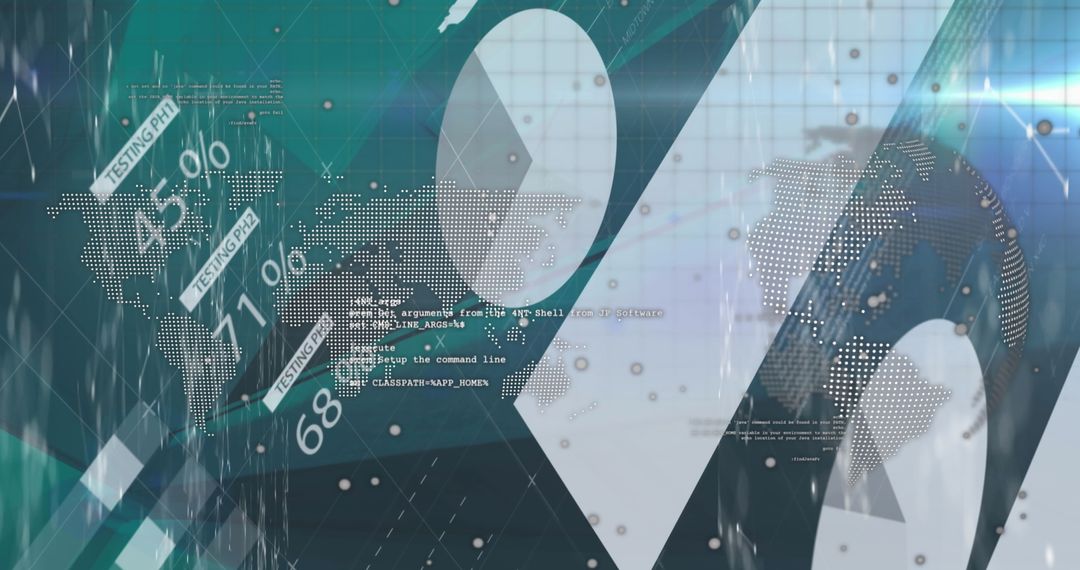
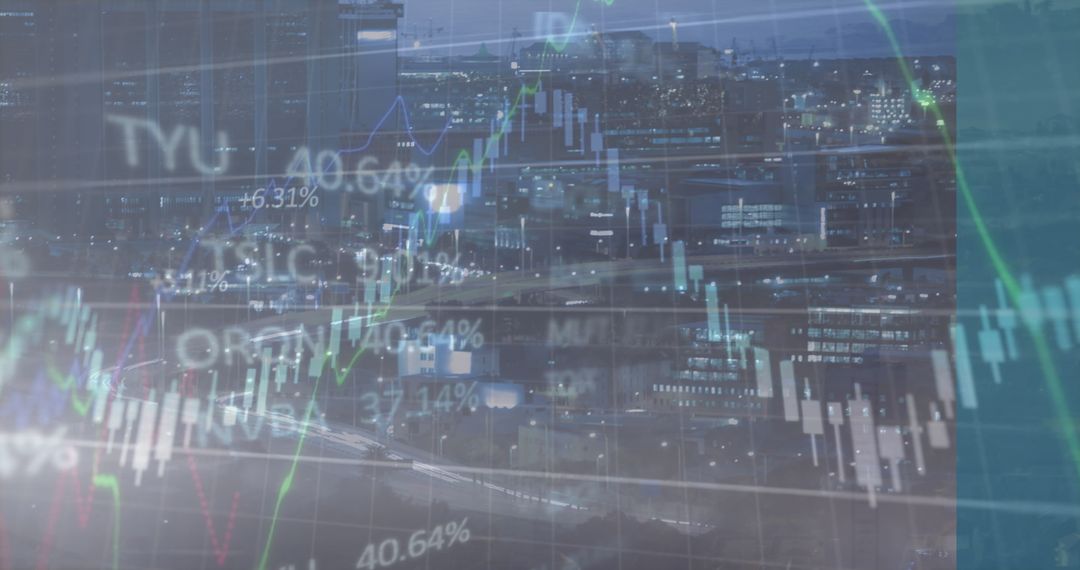
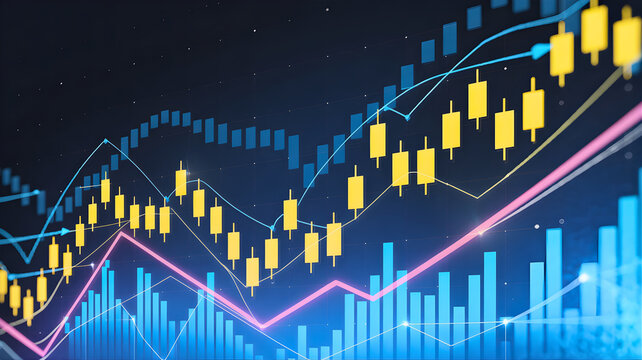
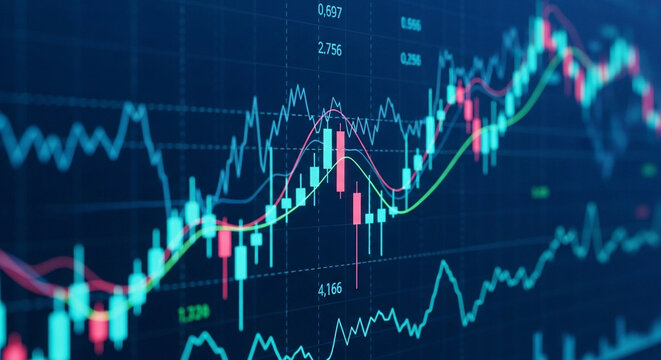
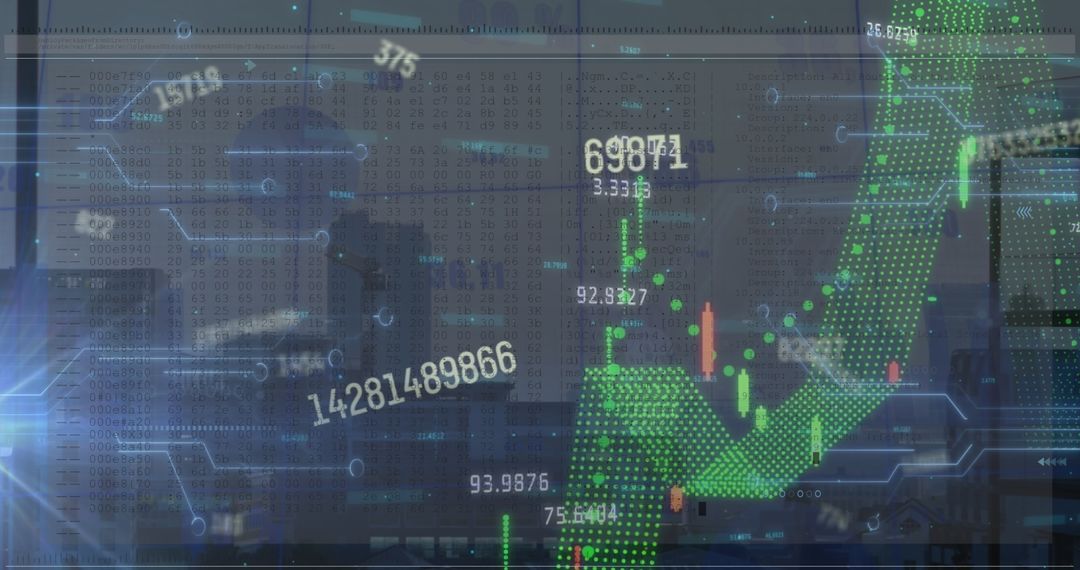
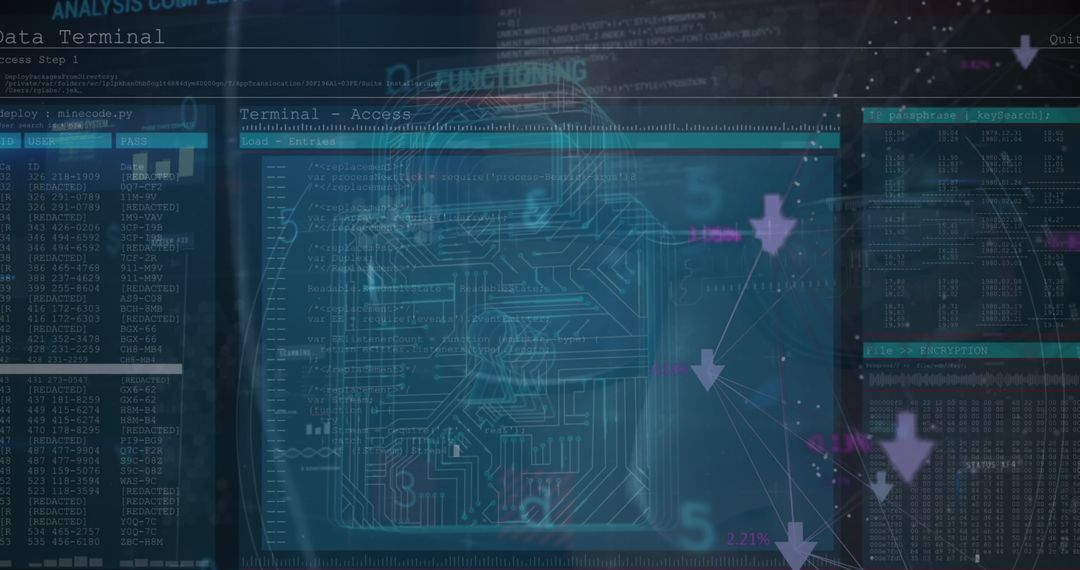
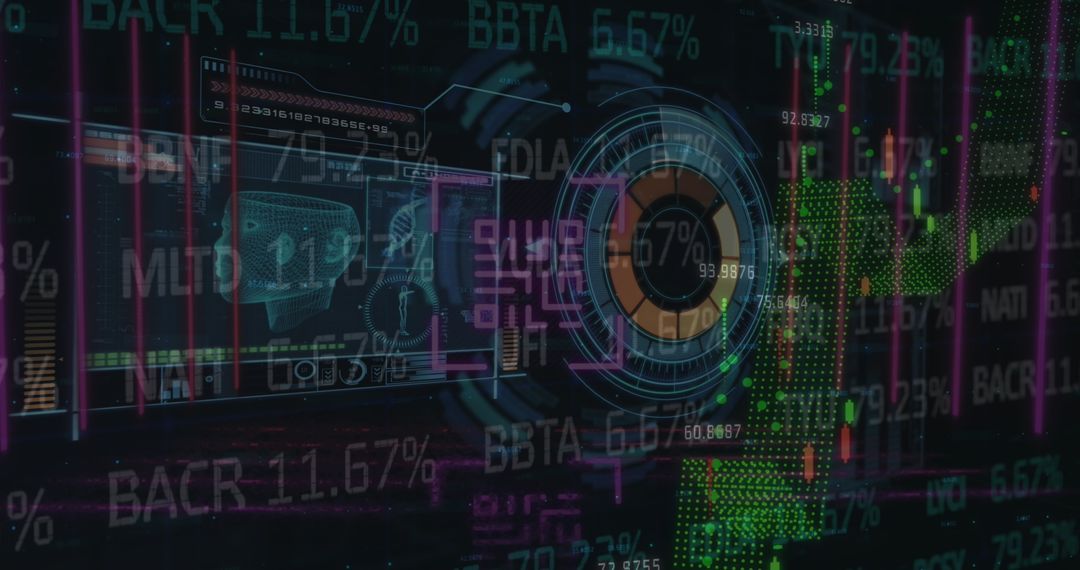
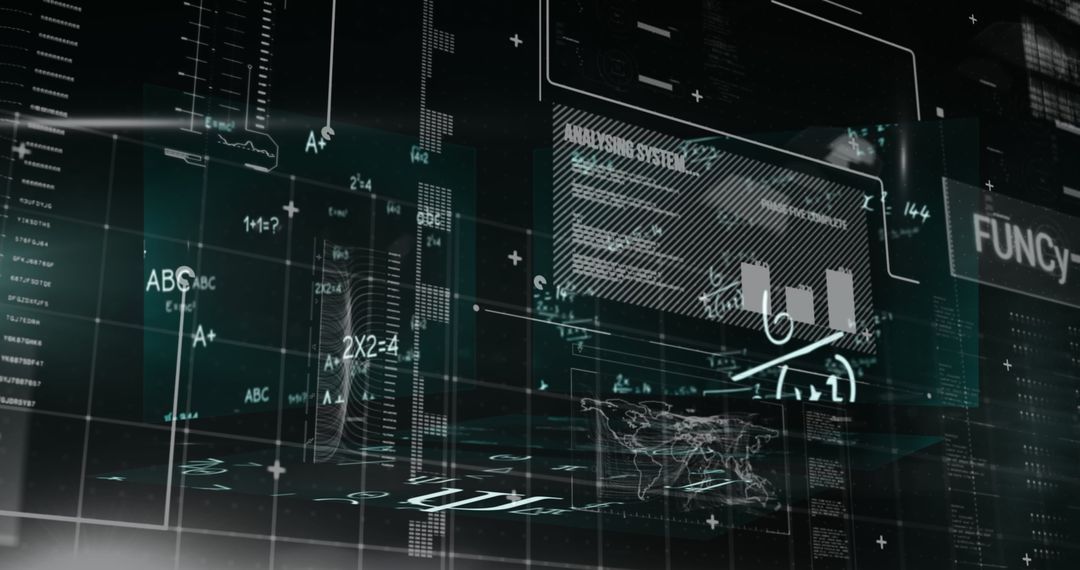
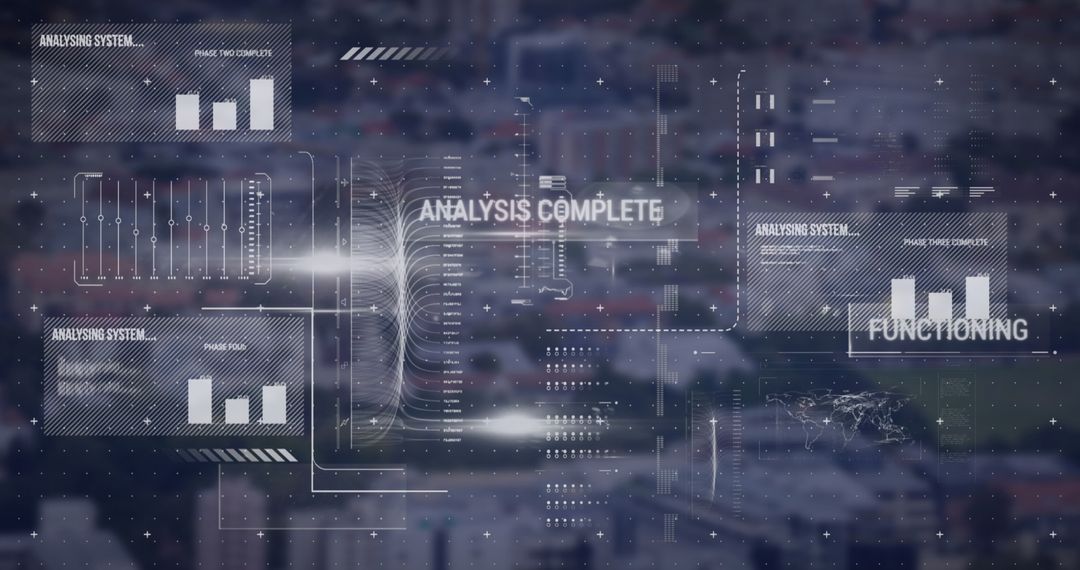
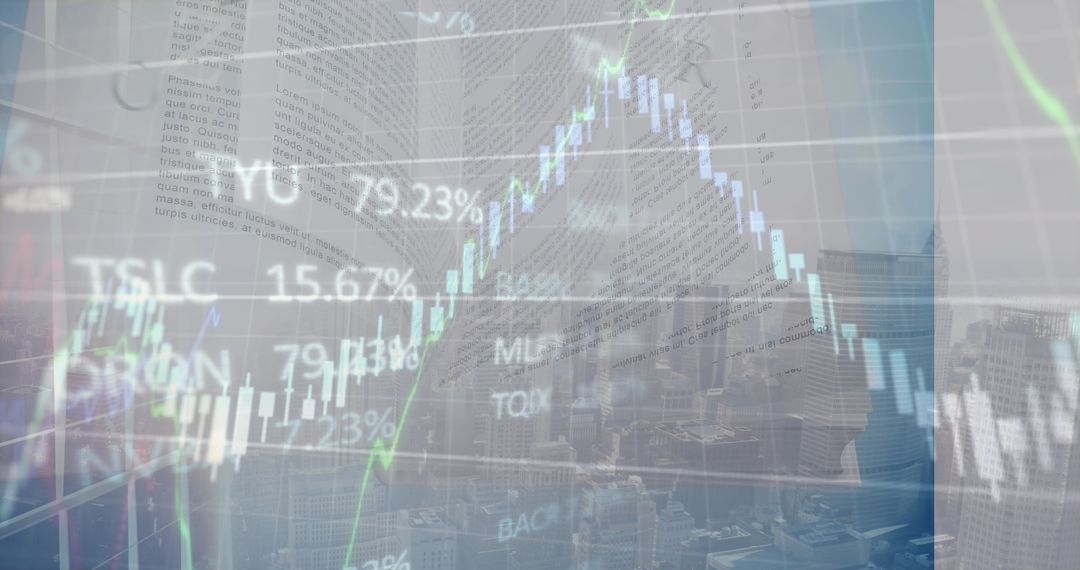
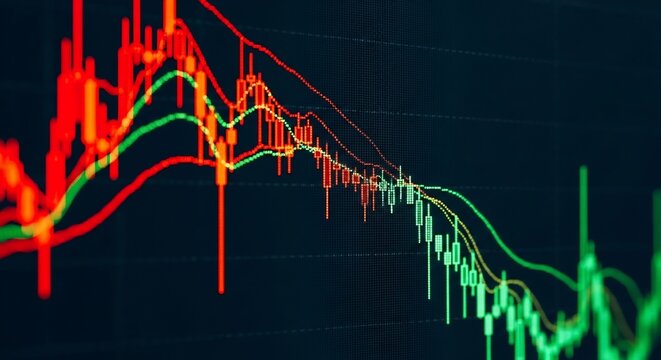
- Digital Financial Analytics with Candlestick and Trend Analysis
Digital Financial Analytics with Candlestick and Trend Analysis Image
Digital representation mergers candlestick charts with colored moving averages and trend lines, emphasizing data visualization in financial analysis. Suitable for presentations involving finance technology or stock market insights, illustrating complex data in modern digital formats.
Powered by 


0
downloads
downloads
Tags:
More
Credit Photo
If you would like to credit the Photo, here are some ways you can do so
Text Link
photo Link
<span class="text-link">
<span>
<a target="_blank" href=https://pikwizard.com/photo/digital-financial-analytics-with-candlestick-and-trend-analysis/a287100e29ab236fe50e6be1ecf6a569/>PikWizard</a>
</span>
</span>
<span class="image-link">
<span
style="margin: 0 0 20px 0; display: inline-block; vertical-align: middle; width: 100%;"
>
<a
target="_blank"
href="https://pikwizard.com/photo/digital-financial-analytics-with-candlestick-and-trend-analysis/a287100e29ab236fe50e6be1ecf6a569/"
style="text-decoration: none; font-size: 10px; margin: 0;"
>
<img src="https://pikwizard.com/pw/medium/a287100e29ab236fe50e6be1ecf6a569.jpg" style="margin: 0; width: 100%;" alt="" />
<p style="font-size: 12px; margin: 0;">PikWizard</p>
</a>
</span>
</span>
Free (free of charge)
Free for personal and commercial use.
Author: Authentic Images
Similar Free Stock Images
Premium


Premium


Premium


Premium

Premium

Premium

Premium


Premium


Premium

Premium


Premium
Premium


Premium


Premium

Premium

Premium

Premium

Premium


Premium


Premium

Premium


Premium


Premium


Premium