
- Home >
- Stock Photos >
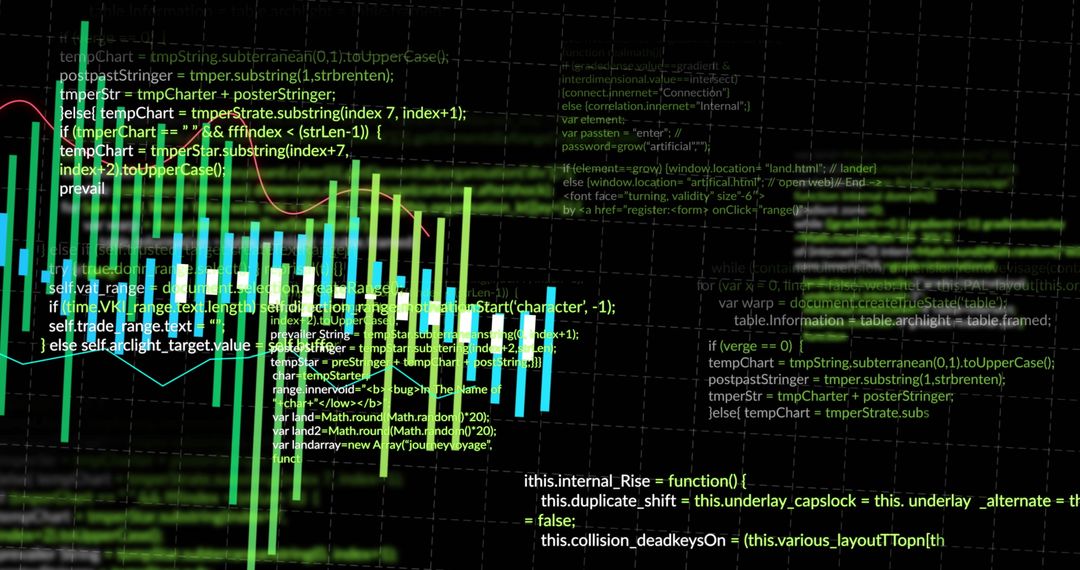
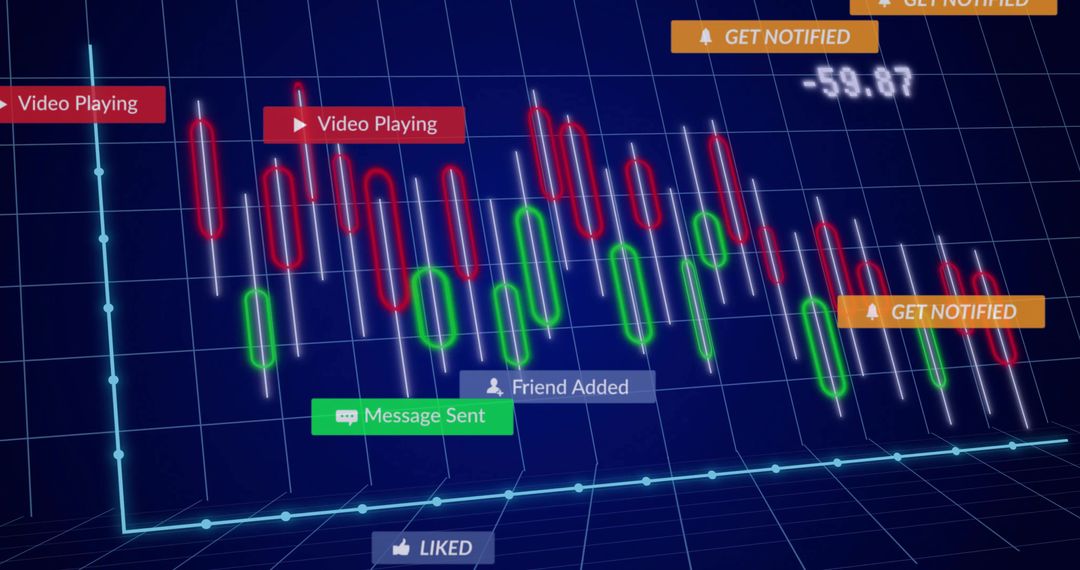
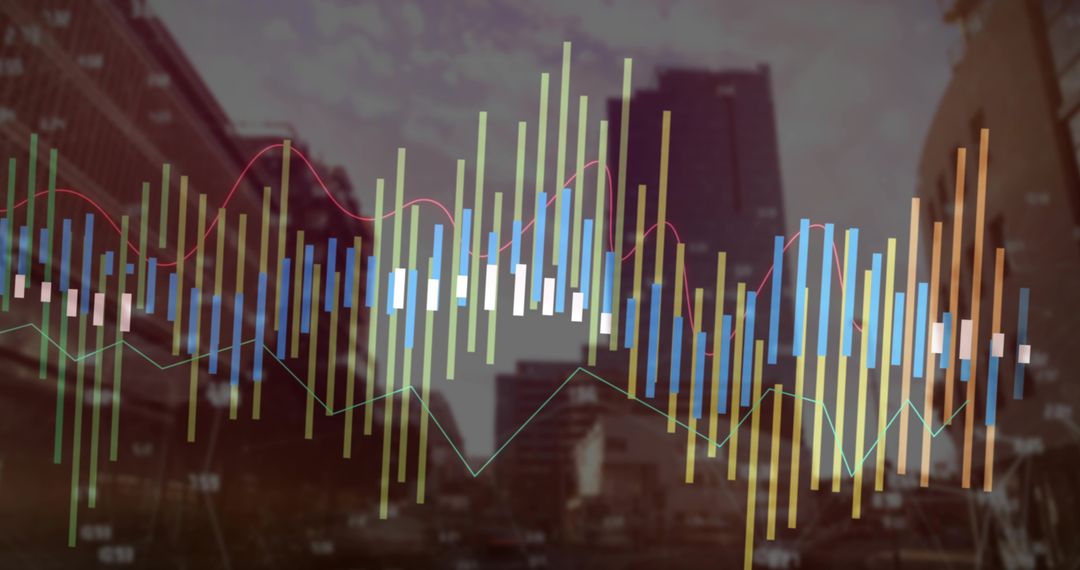
- Digital Financial Chart and Chemical Structurals Illustration
Digital Financial Chart and Chemical Structurals Illustration Image

Vibrant depiction of overlapping financial data charts and chemical structural formulas on a dark background, combining themes of finance and science. Ideal for illustrating concepts around fintech, scientific analytics, interdisciplinary innovation, and complex data interpretation frequently used in technological, business, and educational contexts.
Powered by  - Get 15% off with code: PIKWIZARD15


2
downloads
downloads
Tags:
More
Credit Photo
If you would like to credit the Photo, here are some ways you can do so
Text Link
photo Link
<span class="text-link">
<span>
<a target="_blank" href=https://pikwizard.com/photo/digital-financial-chart-and-chemical-structurals-illustration/d4df2a5f40df0ab47ca20089eb93d8f9/>PikWizard</a>
</span>
</span>
<span class="image-link">
<span
style="margin: 0 0 20px 0; display: inline-block; vertical-align: middle; width: 100%;"
>
<a
target="_blank"
href="https://pikwizard.com/photo/digital-financial-chart-and-chemical-structurals-illustration/d4df2a5f40df0ab47ca20089eb93d8f9/"
style="text-decoration: none; font-size: 10px; margin: 0;"
>
<img src="https://pikwizard.com/pw/medium/d4df2a5f40df0ab47ca20089eb93d8f9.jpg" style="margin: 0; width: 100%;" alt="" />
<p style="font-size: 12px; margin: 0;">PikWizard</p>
</a>
</span>
</span>
Free (free of charge)
Free for personal and commercial use.
Author: People Creations
Similar Free Stock Images

Premium


Premium


Premium


Premium


Premium


Premium


Premium


Premium


Premium


Premium


Premium


Premium


Premium


Premium


Premium


Premium


Premium


Premium


Premium


Premium


Premium


Premium


Premium


Premium

