- Home >
- Stock Photos >
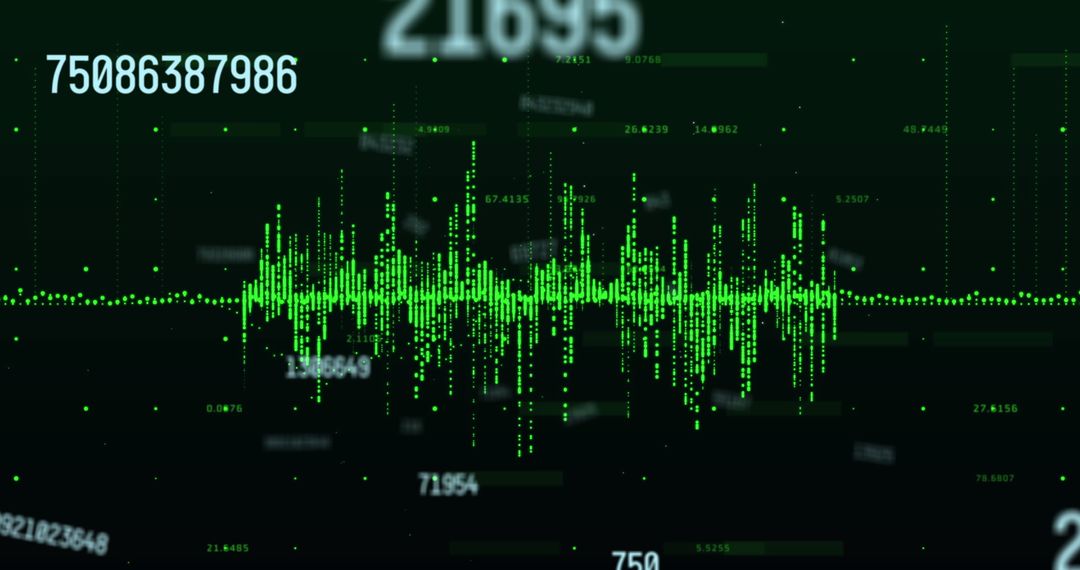
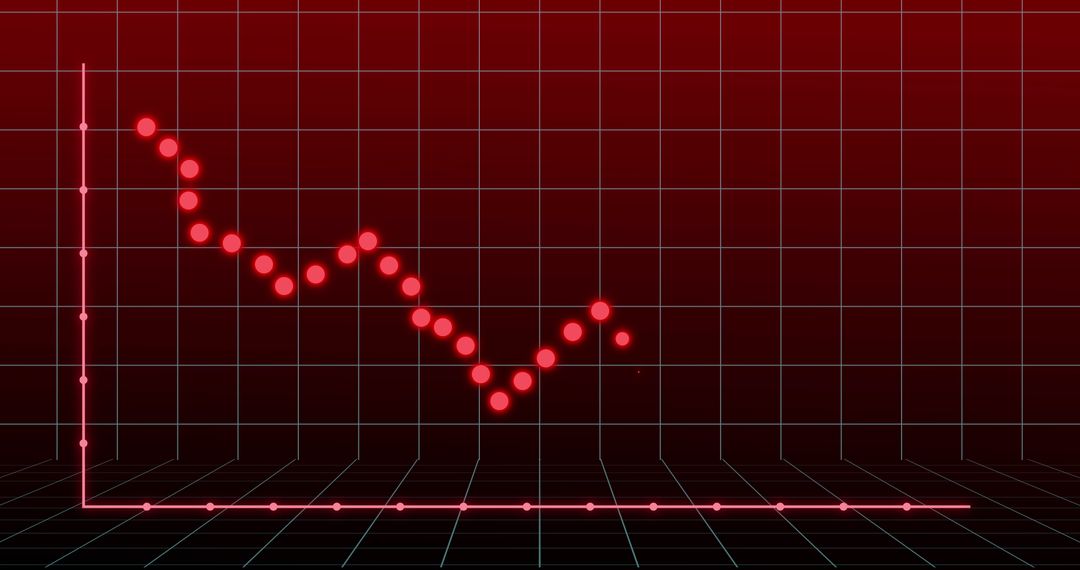
- Digital Financial Chart on Green Background with Figures
Digital Financial Chart on Green Background with Figures Image

Digital financial chart, with circles forming a bar graph against a green background, represents data analysis, statistical information within finance, economic trends or forecasts. Useful for articles, blogs on market analysis/updates, investment strategies, financial reports.
Powered by  - Get 15% off with code: PIKWIZARD15


2
downloads
downloads
Tags:
More
Credit Photo
If you would like to credit the Photo, here are some ways you can do so
Text Link
photo Link
<span class="text-link">
<span>
<a target="_blank" href=https://pikwizard.com/photo/digital-financial-chart-on-green-background-with-figures/446f7853451d80d4dfab6edd6576e945/>PikWizard</a>
</span>
</span>
<span class="image-link">
<span
style="margin: 0 0 20px 0; display: inline-block; vertical-align: middle; width: 100%;"
>
<a
target="_blank"
href="https://pikwizard.com/photo/digital-financial-chart-on-green-background-with-figures/446f7853451d80d4dfab6edd6576e945/"
style="text-decoration: none; font-size: 10px; margin: 0;"
>
<img src="https://pikwizard.com/pw/medium/446f7853451d80d4dfab6edd6576e945.jpg" style="margin: 0; width: 100%;" alt="" />
<p style="font-size: 12px; margin: 0;">PikWizard</p>
</a>
</span>
</span>
Free (free of charge)
Free for personal and commercial use.
Author: Authentic Images
Similar Free Stock Images

Premium


Premium


Premium


Premium


Premium


Premium


Premium


Premium


Premium


Premium


Premium


Premium


Premium


Premium


Premium


Premium


Premium


Premium


Premium


Premium


Premium


Premium


Premium


Premium