- Home >
- Stock Photos >
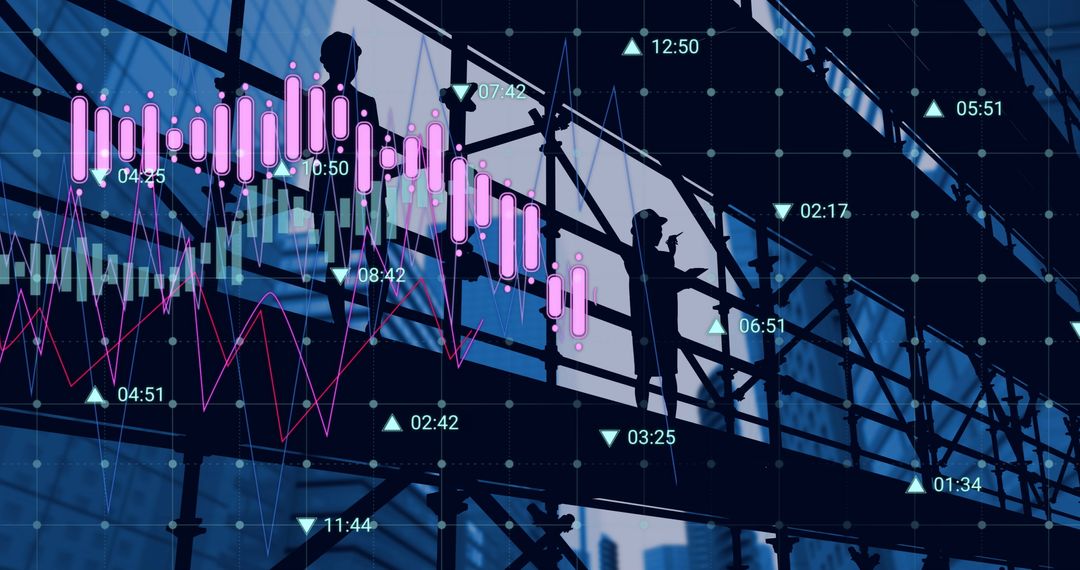
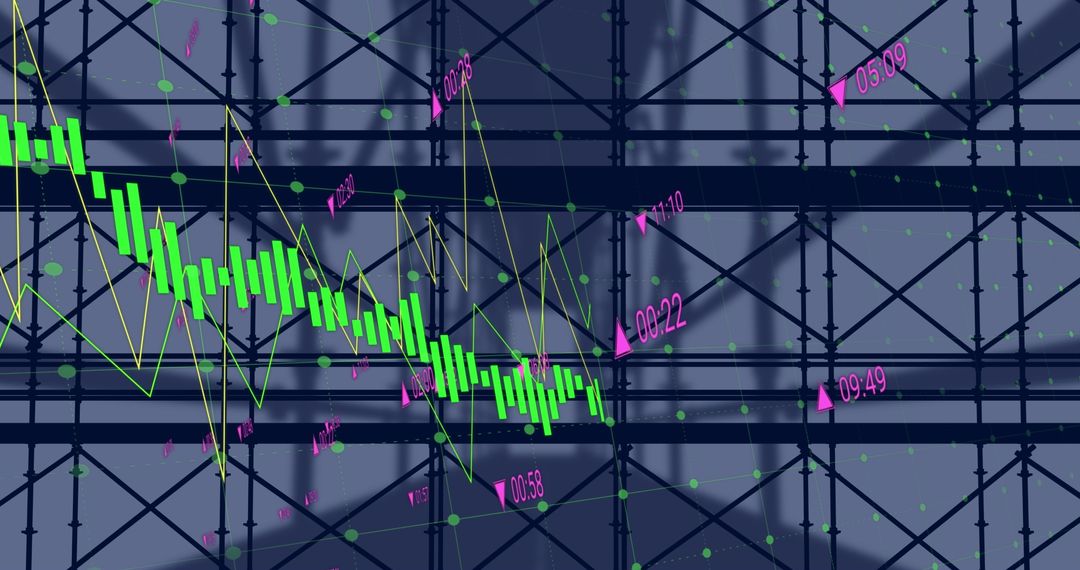
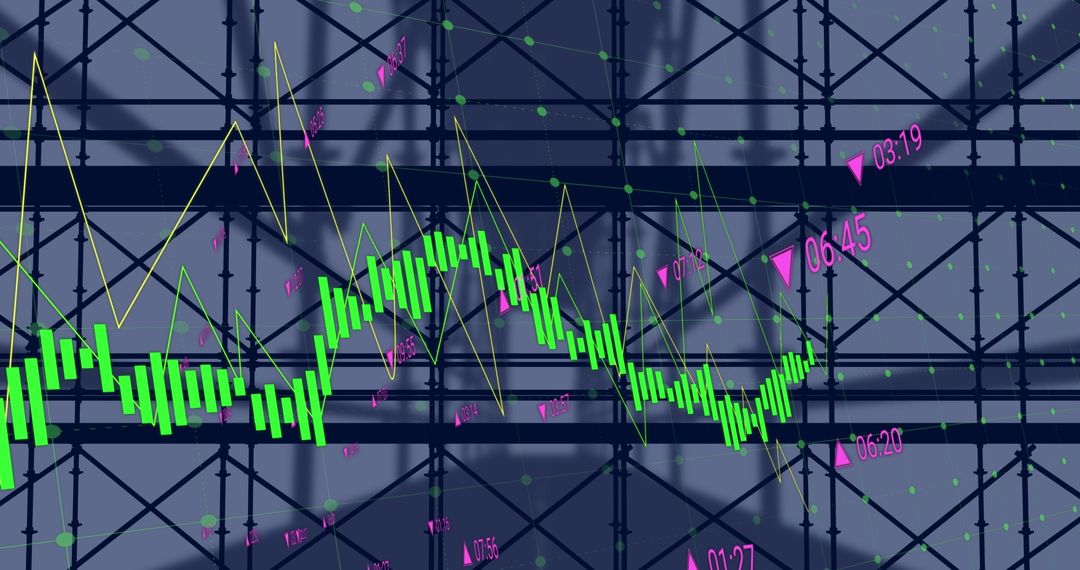
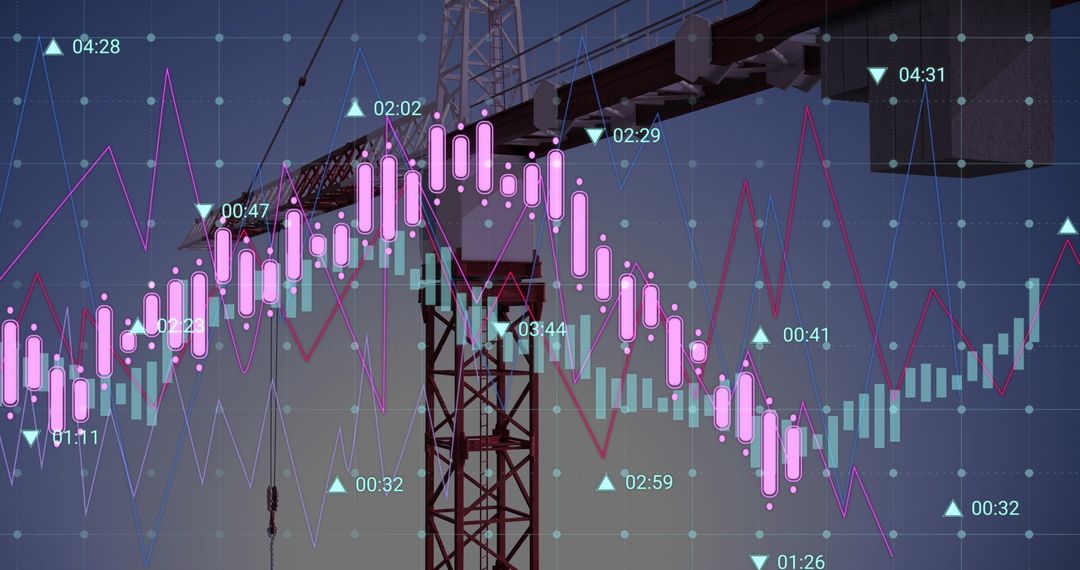
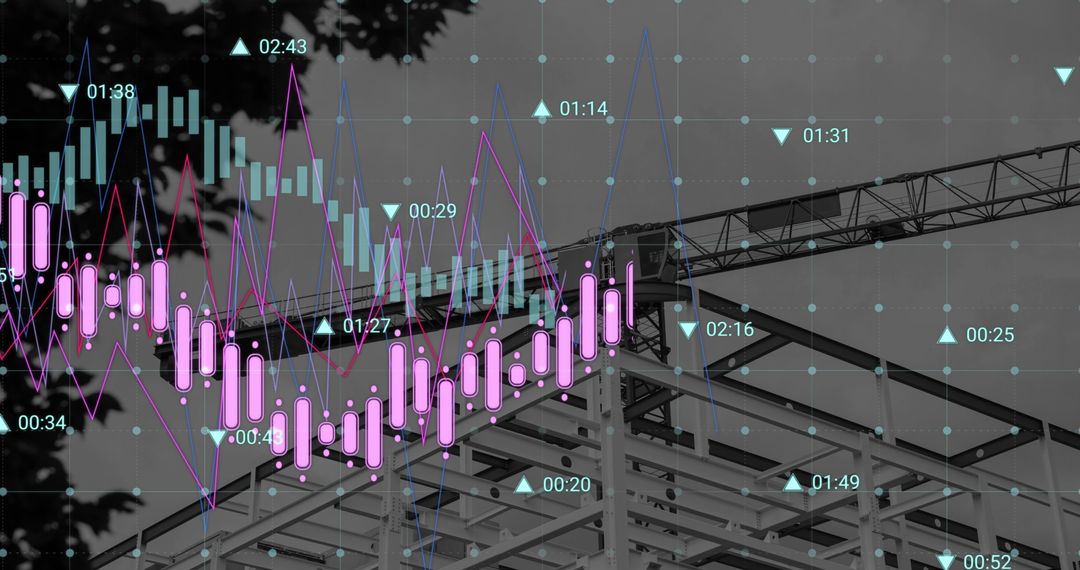
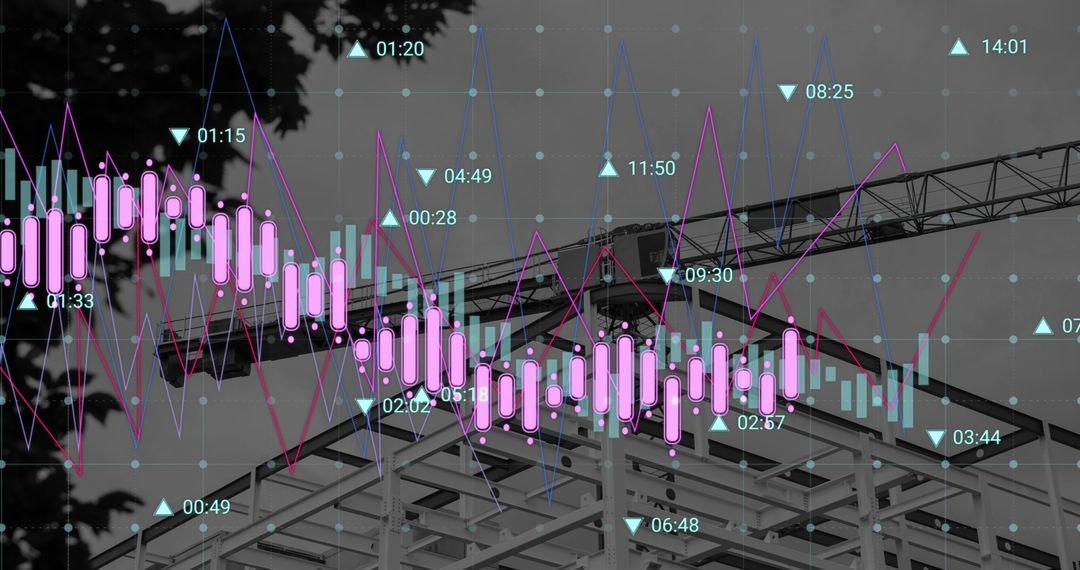
- Digital Financial Chart Overlaying Urban Scaffold Structure
Digital Financial Chart Overlaying Urban Scaffold Structure Image

This visual showcases the intersection of financial data and an urban architectural framework. Suitable for illustrating concepts in technological advancements within the finance sector. Placed in a presentation, it speaks to themes of data processing, digital development, and global business strategies in the financial world.
Powered by  - Get 15% off with code: PIKWIZARD15


2
downloads
downloads
Tags:
More
Credit Photo
If you would like to credit the Photo, here are some ways you can do so
Text Link
photo Link
<span class="text-link">
<span>
<a target="_blank" href=https://pikwizard.com/photo/digital-financial-chart-overlaying-urban-scaffold-structure/054b53122628eee3de58697d868d22e2/>PikWizard</a>
</span>
</span>
<span class="image-link">
<span
style="margin: 0 0 20px 0; display: inline-block; vertical-align: middle; width: 100%;"
>
<a
target="_blank"
href="https://pikwizard.com/photo/digital-financial-chart-overlaying-urban-scaffold-structure/054b53122628eee3de58697d868d22e2/"
style="text-decoration: none; font-size: 10px; margin: 0;"
>
<img src="https://pikwizard.com/pw/medium/054b53122628eee3de58697d868d22e2.jpg" style="margin: 0; width: 100%;" alt="" />
<p style="font-size: 12px; margin: 0;">PikWizard</p>
</a>
</span>
</span>
Free (free of charge)
Free for personal and commercial use.
Author: Creative Art
Similar Free Stock Images

Premium


Premium


Premium


Premium


Premium


Premium


Premium


Premium


Premium


Premium


Premium


Premium


Premium


Premium


Premium


Premium


Premium


Premium


Premium


Premium


Premium


Premium


Premium


Premium