
- Home >
- Stock Photos >
- Digital Financial Dashboard on Trading Screen Visualizing Data Trends
Digital Financial Dashboard on Trading Screen Visualizing Data Trends Image
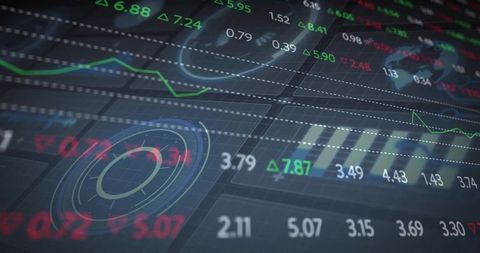
This visually rich scene shows a financial dashboard featuring various data elements such as line graphs, radar charts, and price indicators. Designed for use in trading environments, it is ideally suited for projects related to finance, stock market analysis, data visualization, and business intelligence. This image speaks to the modern intersection of technology and finance, perfect for illustrating articles, presentations, or reports on market analytics, investments, and trading technology.
Powered by 


0
downloads
downloads
Tags:
More
Credit Photo
If you would like to credit the Photo, here are some ways you can do so
Text Link
photo Link
<span class="text-link">
<span>
<a target="_blank" href=https://pikwizard.com/photo/digital-financial-dashboard-on-trading-screen-visualizing-data-trends/0585d4c9d68ceb21fd5b573e50fbd70a/>PikWizard</a>
</span>
</span>
<span class="image-link">
<span
style="margin: 0 0 20px 0; display: inline-block; vertical-align: middle; width: 100%;"
>
<a
target="_blank"
href="https://pikwizard.com/photo/digital-financial-dashboard-on-trading-screen-visualizing-data-trends/0585d4c9d68ceb21fd5b573e50fbd70a/"
style="text-decoration: none; font-size: 10px; margin: 0;"
>
<img src="https://pikwizard.com/pw/medium/0585d4c9d68ceb21fd5b573e50fbd70a.jpg" style="margin: 0; width: 100%;" alt="" />
<p style="font-size: 12px; margin: 0;">PikWizard</p>
</a>
</span>
</span>
Free (free of charge)
Free for personal and commercial use.
Author: Creative Art