- Home >
- Stock Photos >
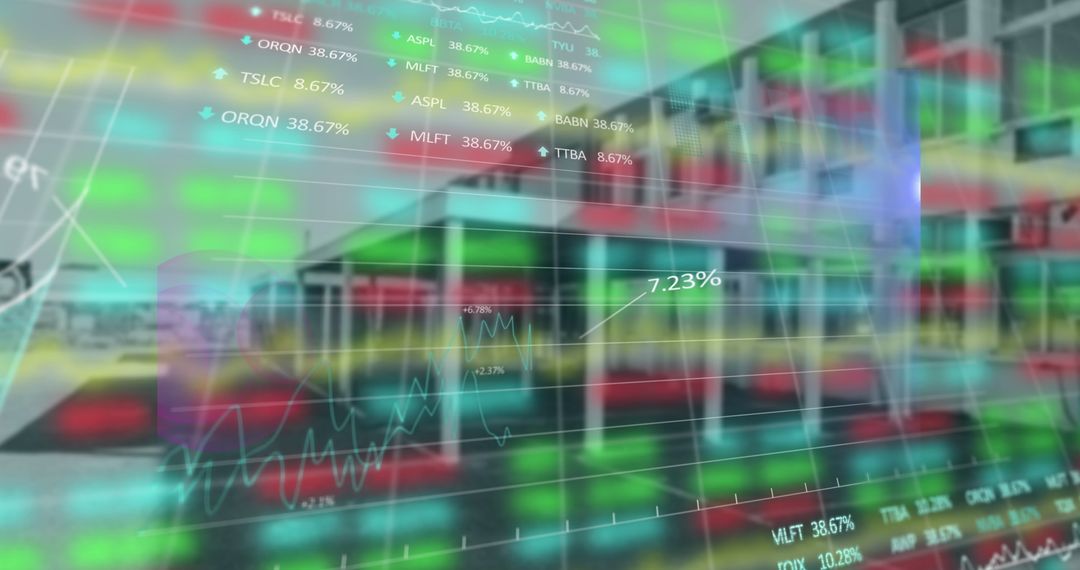
- Digital Financial Dashboard with Charts and Analytics
Digital Financial Dashboard with Charts and Analytics Image

Ideal for illustrating financial analysis and digital trading environments. Suitable for use in fintech presentations, online financial blogs, and digital financial service advertisements to highlight technology integration and global financial monitoring.
Powered by  - Get 15% off with code: PIKWIZARD15


2
downloads
downloads
Tags:
More
Credit Photo
If you would like to credit the Photo, here are some ways you can do so
Text Link
photo Link
<span class="text-link">
<span>
<a target="_blank" href=https://pikwizard.com/photo/digital-financial-dashboard-with-charts-and-analytics/d0be04eeddfdc146870576c0ade6db32/>PikWizard</a>
</span>
</span>
<span class="image-link">
<span
style="margin: 0 0 20px 0; display: inline-block; vertical-align: middle; width: 100%;"
>
<a
target="_blank"
href="https://pikwizard.com/photo/digital-financial-dashboard-with-charts-and-analytics/d0be04eeddfdc146870576c0ade6db32/"
style="text-decoration: none; font-size: 10px; margin: 0;"
>
<img src="https://pikwizard.com/pw/medium/d0be04eeddfdc146870576c0ade6db32.jpg" style="margin: 0; width: 100%;" alt="" />
<p style="font-size: 12px; margin: 0;">PikWizard</p>
</a>
</span>
</span>
Free (free of charge)
Free for personal and commercial use.
Author: People Creations
Similar Free Stock Images

Premium


Premium


Premium


Premium


Premium


Premium


Premium


Premium


Premium


Premium


Premium


Premium


Premium


Premium


Premium


Premium


Premium


Premium


Premium


Premium


Premium


Premium


Premium


Premium