- Home >
- Stock Photos >
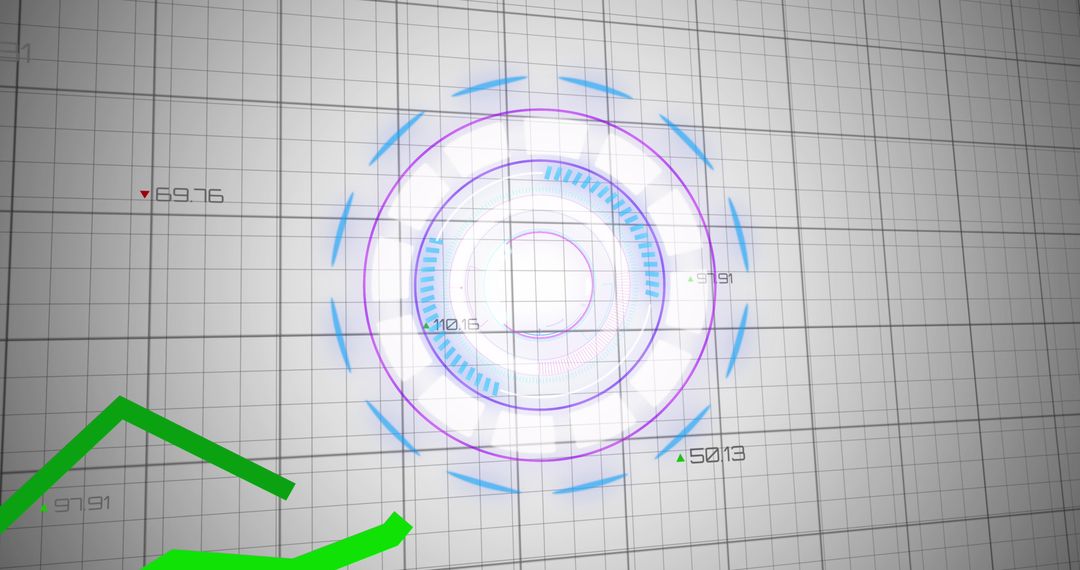
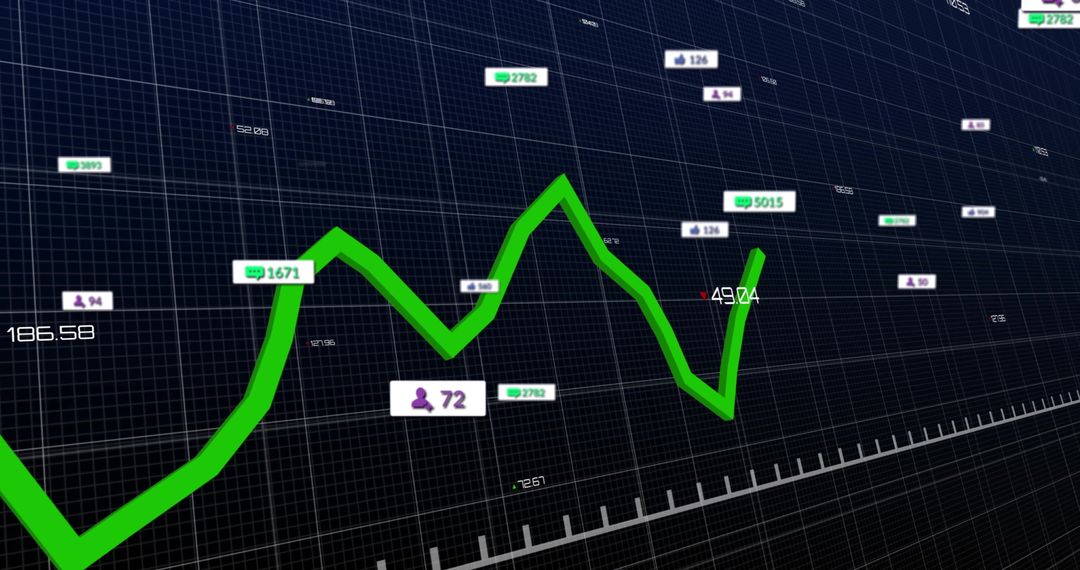
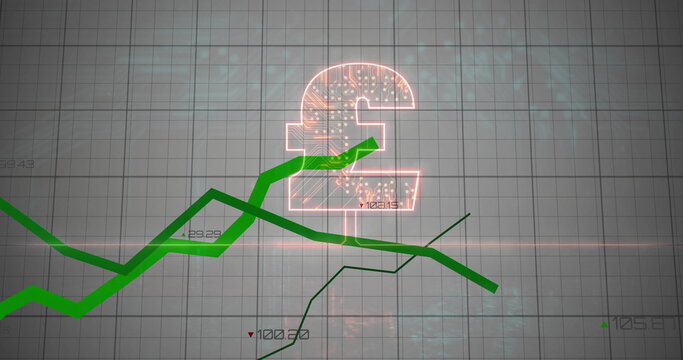
- Digital Financial Dashboard with Glowing Pound and Rising Chart
Digital Financial Dashboard with Glowing Pound and Rising Chart Image
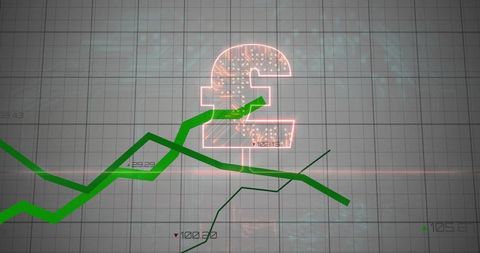
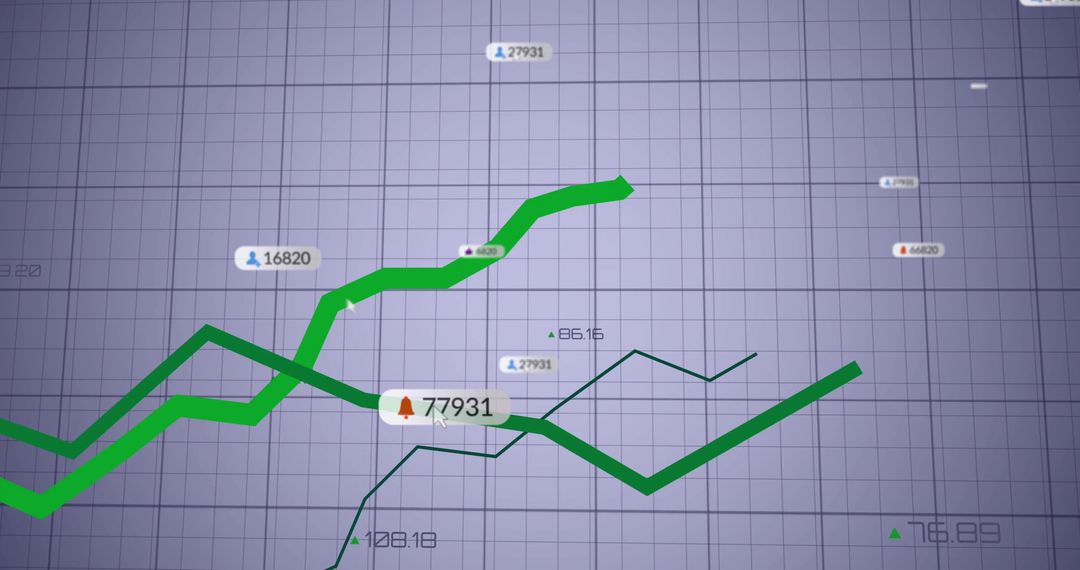
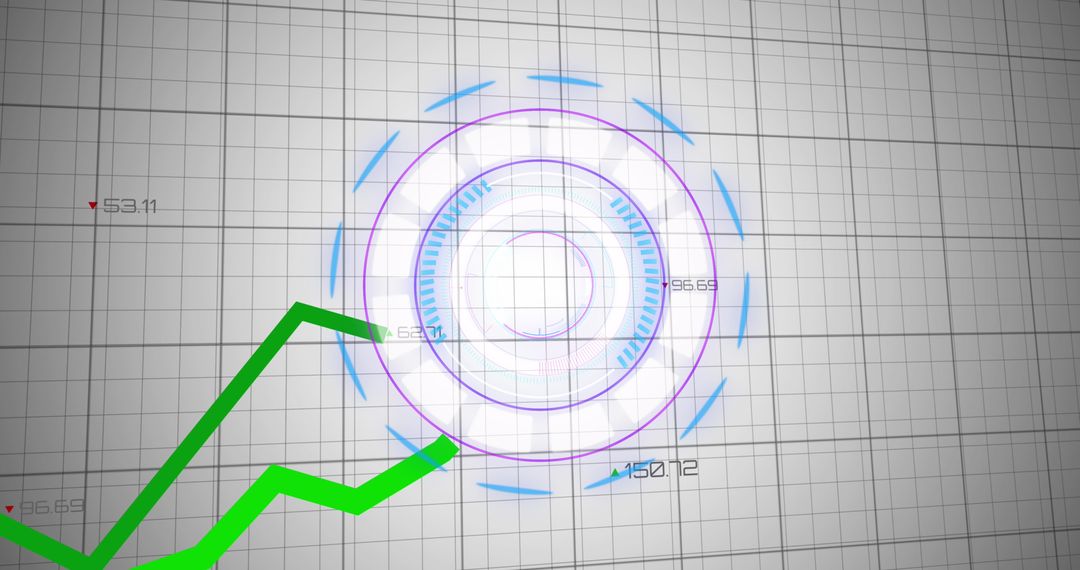
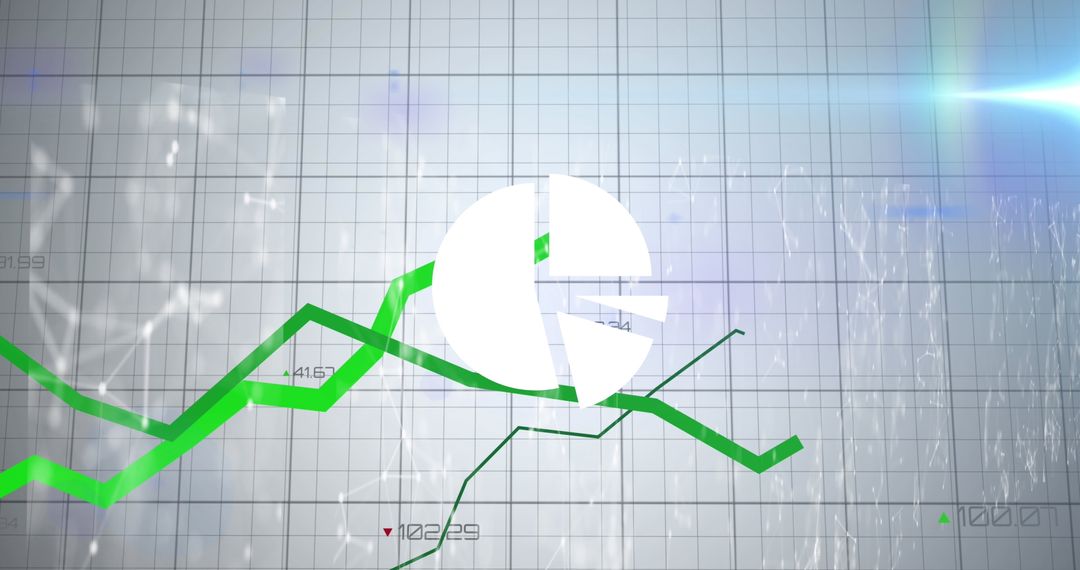
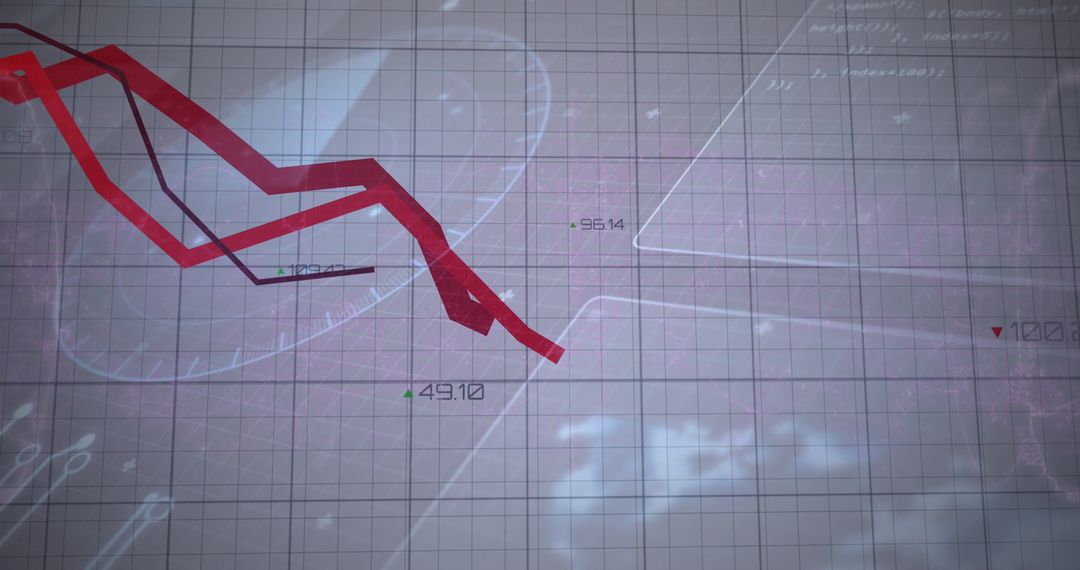
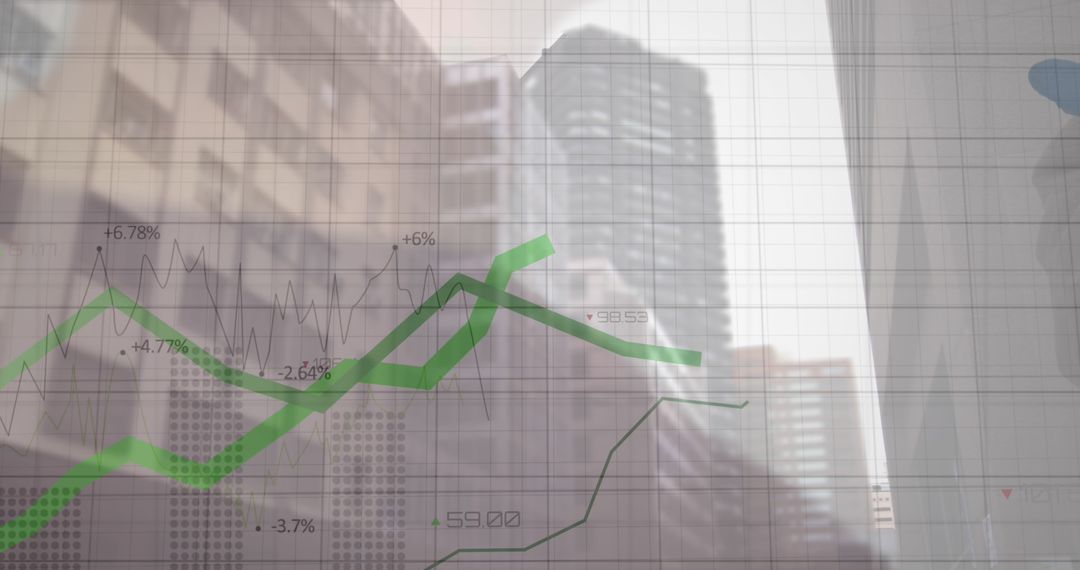
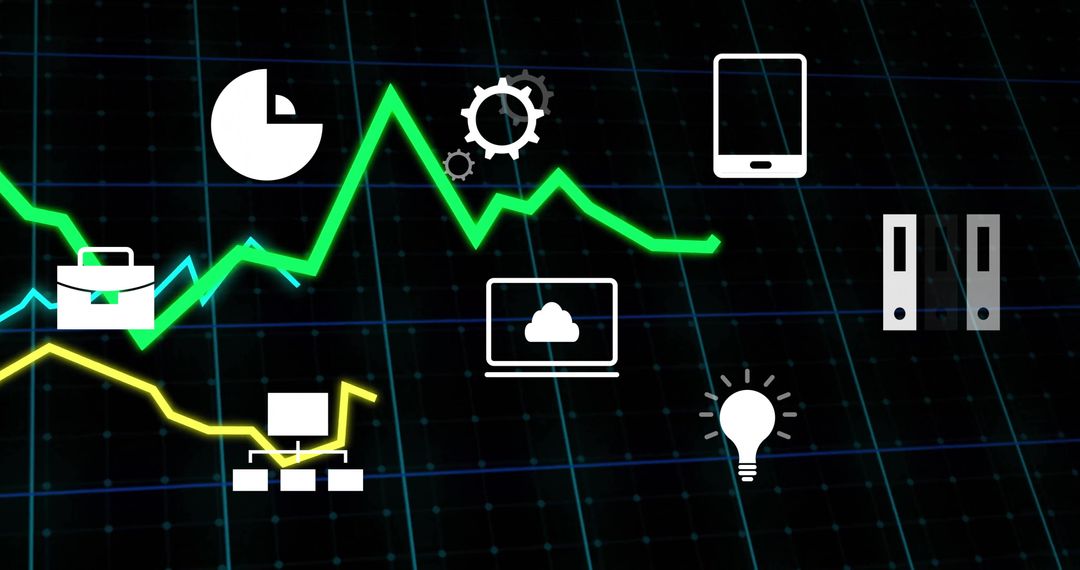
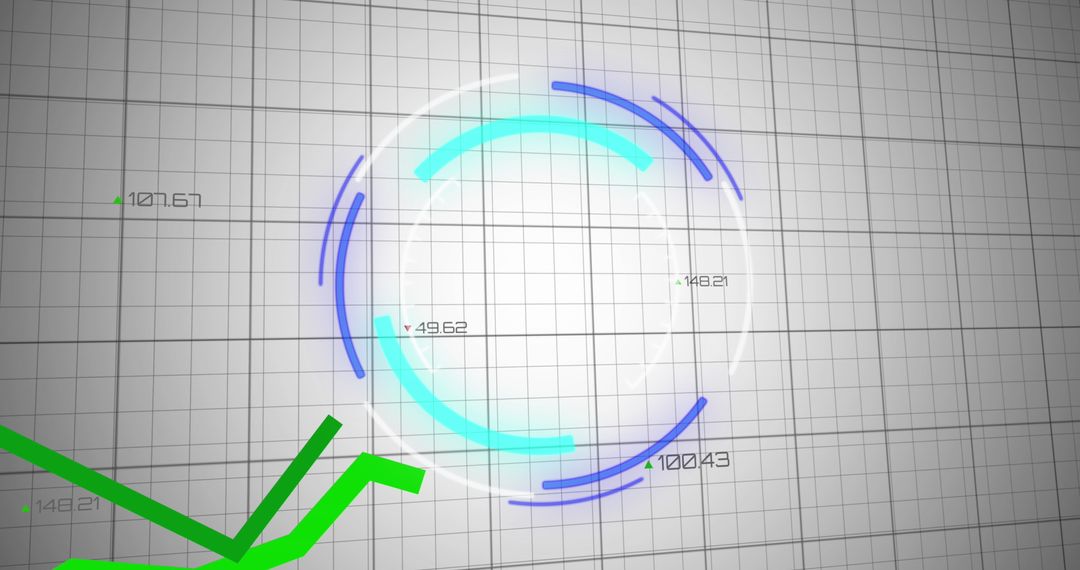
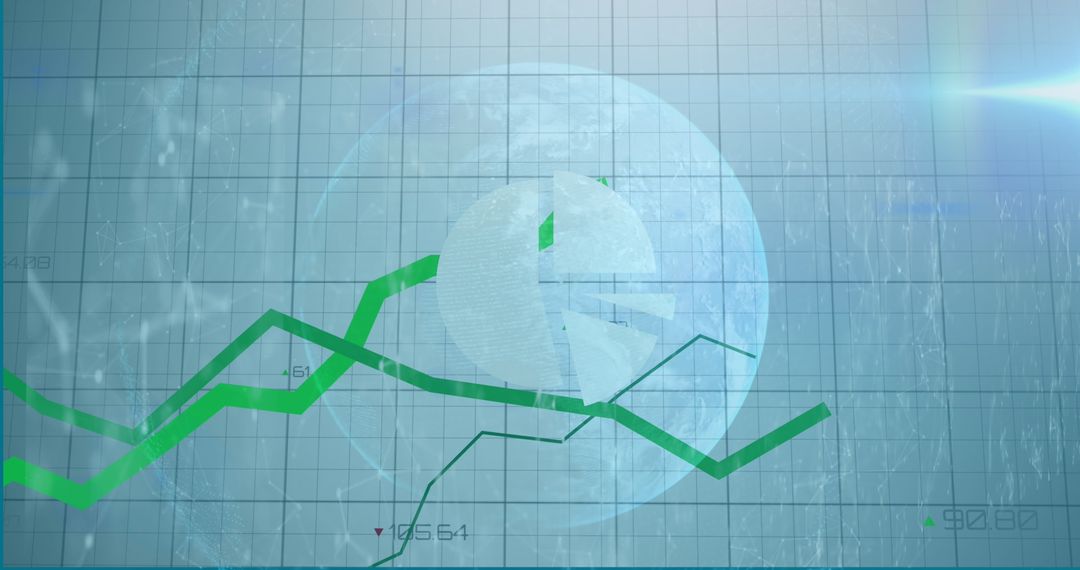
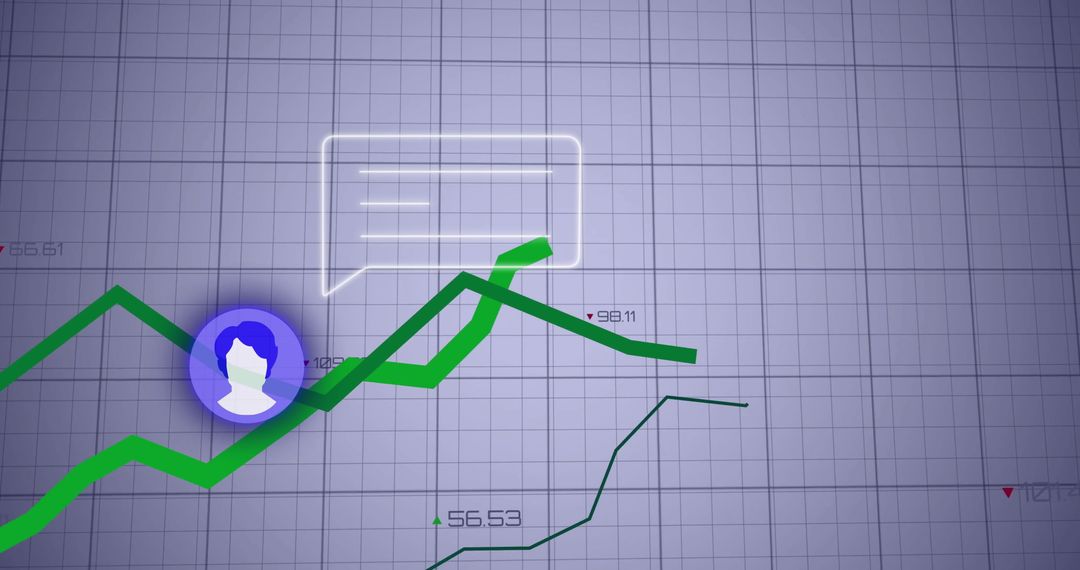
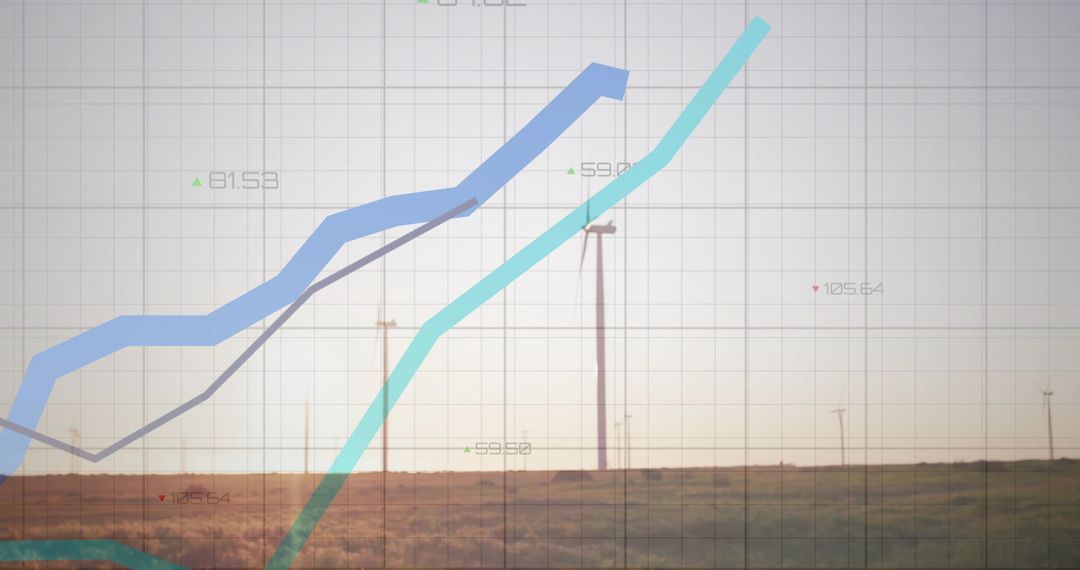
Futuristic financial interface showing digital mechanics. Ideal for conveying themes of investment, technology, and analytics. Use in presentations about business performance or economic growth tied to the pound sterling.
Powered by 


0
downloads
downloads
Tags:
More
Credit Photo
If you would like to credit the Photo, here are some ways you can do so
Text Link
photo Link
<span class="text-link">
<span>
<a target="_blank" href=https://pikwizard.com/photo/digital-financial-dashboard-with-glowing-pound-and-rising-chart/9335c3a7184fe8678ac51e2d3a5e8ba9/>PikWizard</a>
</span>
</span>
<span class="image-link">
<span
style="margin: 0 0 20px 0; display: inline-block; vertical-align: middle; width: 100%;"
>
<a
target="_blank"
href="https://pikwizard.com/photo/digital-financial-dashboard-with-glowing-pound-and-rising-chart/9335c3a7184fe8678ac51e2d3a5e8ba9/"
style="text-decoration: none; font-size: 10px; margin: 0;"
>
<img src="https://pikwizard.com/pw/medium/9335c3a7184fe8678ac51e2d3a5e8ba9.jpg" style="margin: 0; width: 100%;" alt="" />
<p style="font-size: 12px; margin: 0;">PikWizard</p>
</a>
</span>
</span>
Free (free of charge)
Free for personal and commercial use.
Author: Authentic Images
Similar Free Stock Images