
- Home >
- Stock Photos >
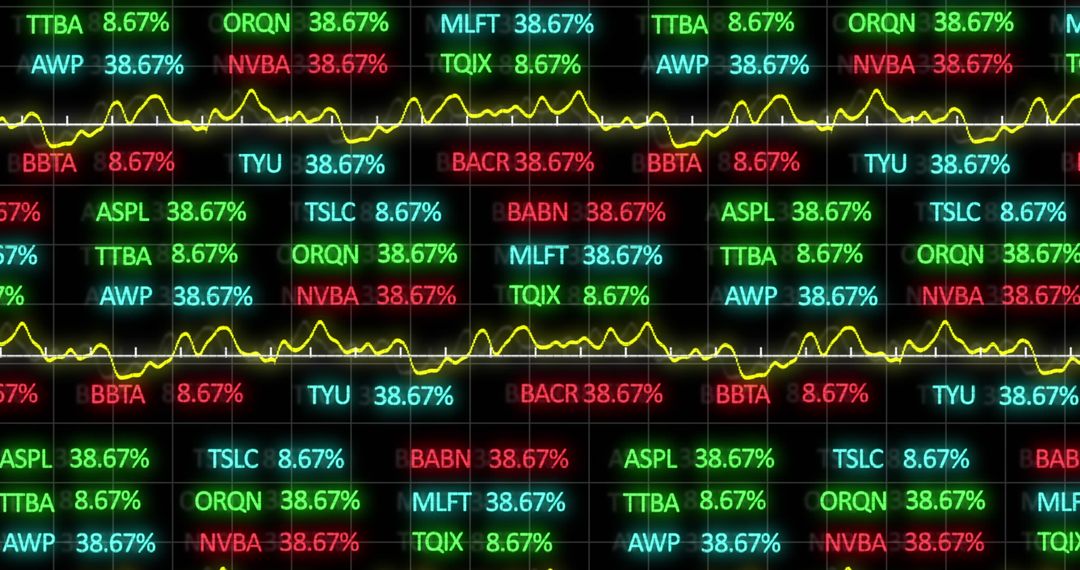
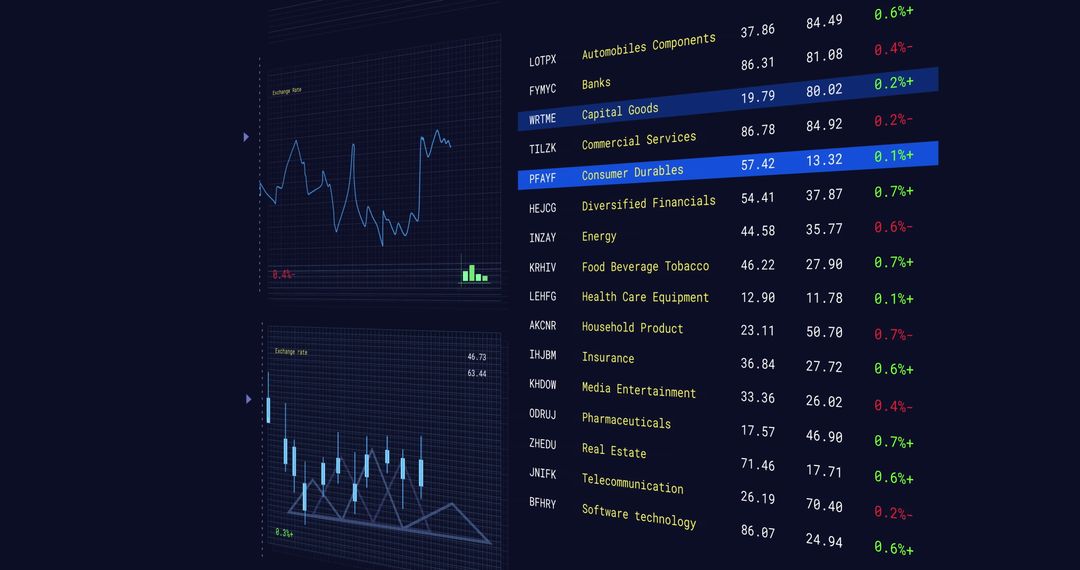
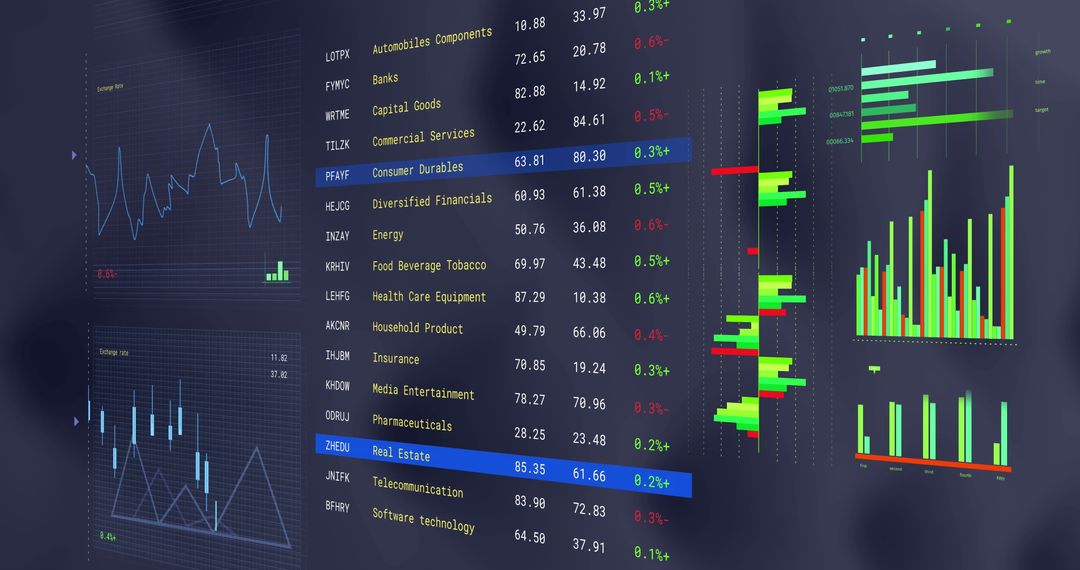
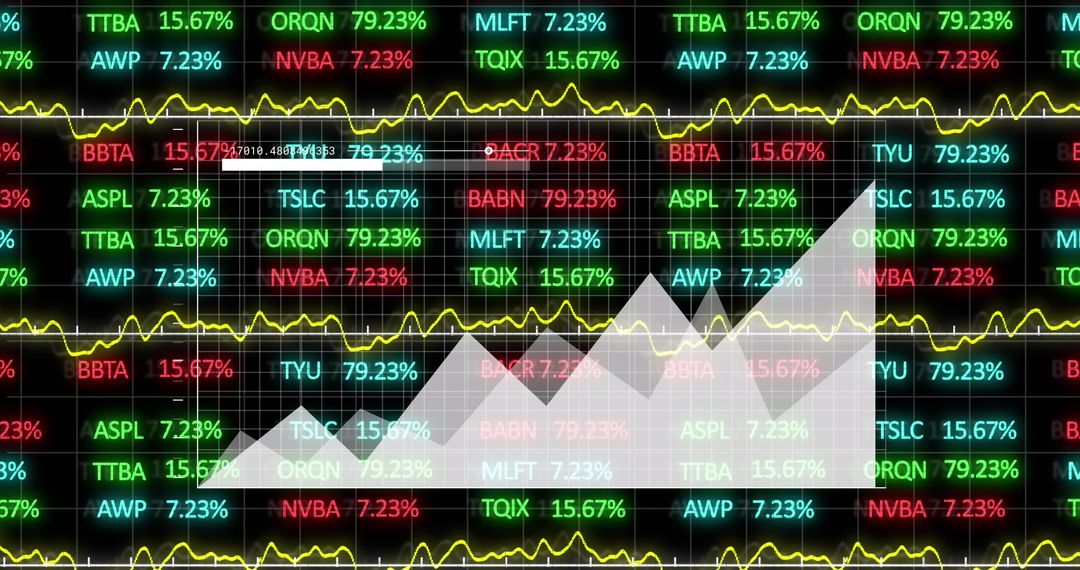
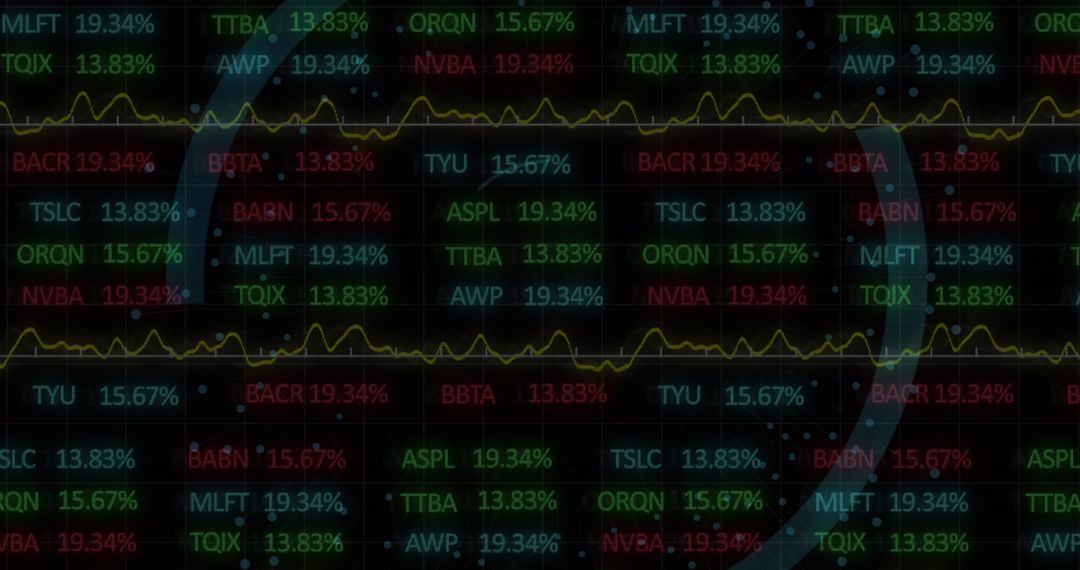
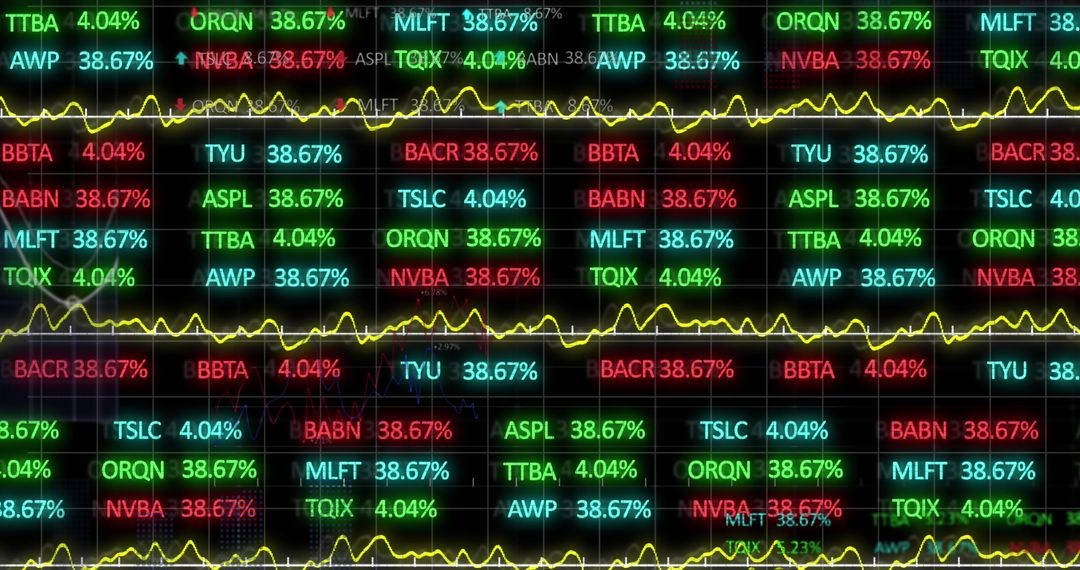
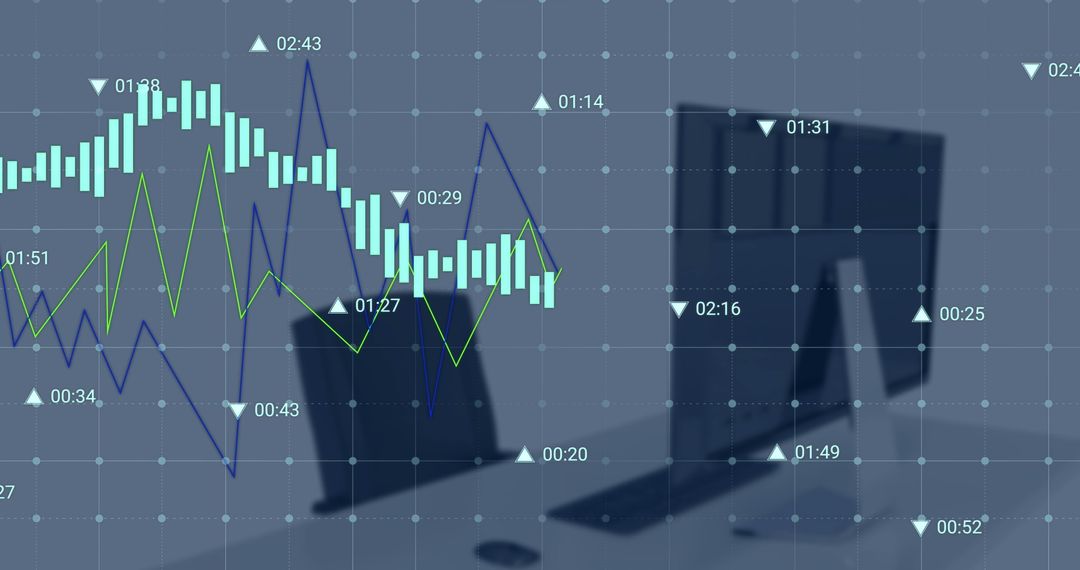
- Digital Financial Data Analysis Dashboard Displaying Stock Market Trends
Digital Financial Data Analysis Dashboard Displaying Stock Market Trends Image
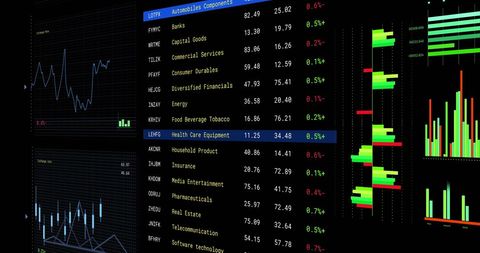
This visualization is ideal for illustrating scenarios involving financial data analysis and stock market behavior, suitable as a backdrop for reports or presentations on finance, global networks, or technology-related topics. The detailed groups of graphs and data entry features convey professionalism and expertise, attracting businesses and educational uses. Perfect for depicting the precision and accuracy vital in financial computing and data analysis sectors.
Powered by  - Get 15% off with code: PIKWIZARD15


2
downloads
downloads
Tags:
More
Credit Photo
If you would like to credit the Photo, here are some ways you can do so
Text Link
photo Link
<span class="text-link">
<span>
<a target="_blank" href=https://pikwizard.com/photo/digital-financial-data-analysis-dashboard-displaying-stock-market-trends/f6aec7b4baa2c189f1819cb2d685837f/>PikWizard</a>
</span>
</span>
<span class="image-link">
<span
style="margin: 0 0 20px 0; display: inline-block; vertical-align: middle; width: 100%;"
>
<a
target="_blank"
href="https://pikwizard.com/photo/digital-financial-data-analysis-dashboard-displaying-stock-market-trends/f6aec7b4baa2c189f1819cb2d685837f/"
style="text-decoration: none; font-size: 10px; margin: 0;"
>
<img src="https://pikwizard.com/pw/medium/f6aec7b4baa2c189f1819cb2d685837f.jpg" style="margin: 0; width: 100%;" alt="" />
<p style="font-size: 12px; margin: 0;">PikWizard</p>
</a>
</span>
</span>
Free (free of charge)
Free for personal and commercial use.
Author: Creative Art
Similar Free Stock Images

Premium


Premium


Premium


Premium


Premium


Premium


Premium


Premium


Premium


Premium


Premium


Premium


Premium


Premium


Premium


Premium


Premium


Premium


Premium


Premium


Premium


Premium


Premium


Premium

