
- Home >
- Stock Photos >
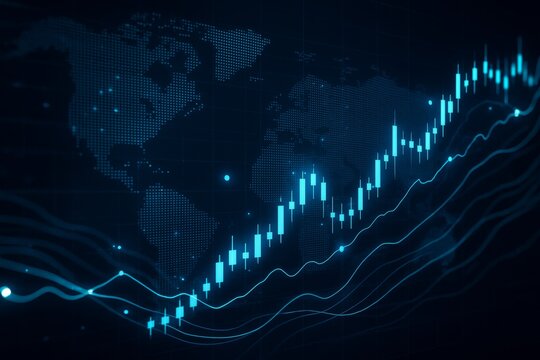
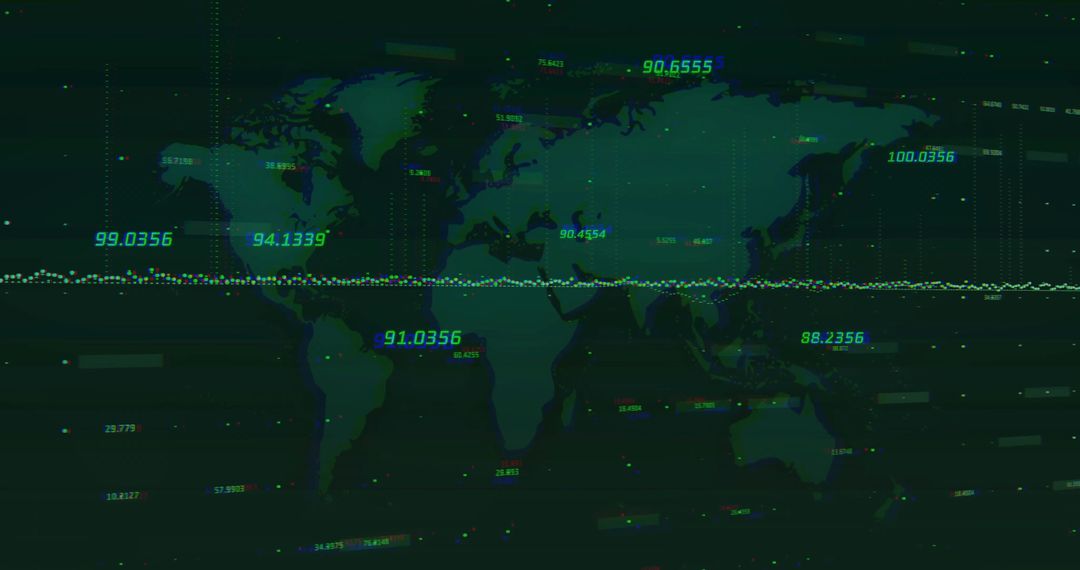
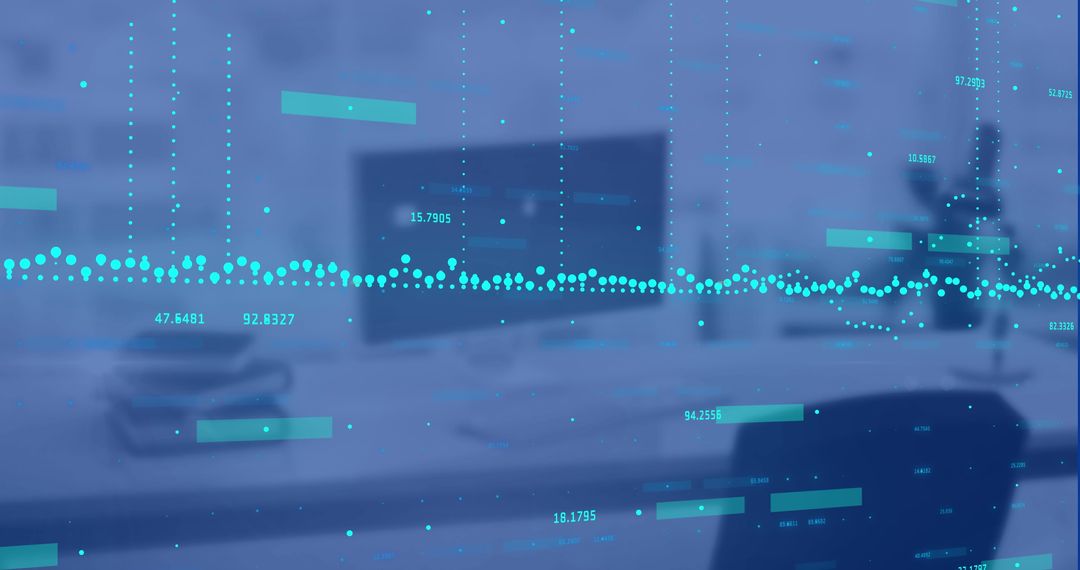
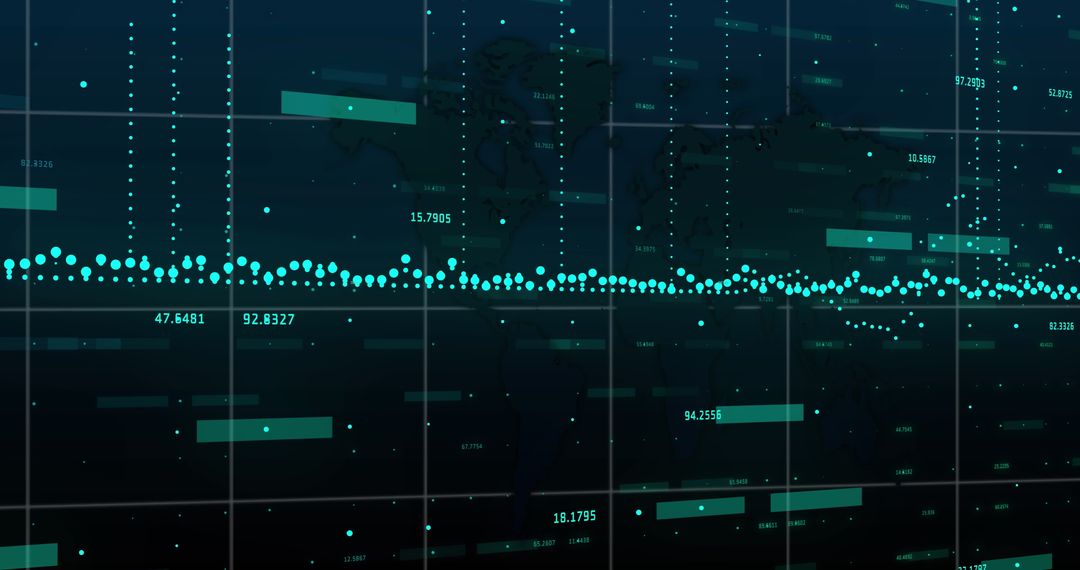
- Digital Financial Data Over Global Map, Futuristic Analytics
Digital Financial Data Over Global Map, Futuristic Analytics Image

Abstract artwork portraying a stream of financial data points processing globally across a map backdrop, evoking a modern and high-tech theme. Use for content involving cutting-edge finance technology, global economics, data analytics, fintech developments, or trends in digital trading platforms.
Powered by 


2
downloads
downloads
Tags:
More
Credit Photo
If you would like to credit the Photo, here are some ways you can do so
Text Link
photo Link
<span class="text-link">
<span>
<a target="_blank" href=https://pikwizard.com/photo/digital-financial-data-over-global-map-futuristic-analytics/c4236b3180c134a3df61196ee7b93249/>PikWizard</a>
</span>
</span>
<span class="image-link">
<span
style="margin: 0 0 20px 0; display: inline-block; vertical-align: middle; width: 100%;"
>
<a
target="_blank"
href="https://pikwizard.com/photo/digital-financial-data-over-global-map-futuristic-analytics/c4236b3180c134a3df61196ee7b93249/"
style="text-decoration: none; font-size: 10px; margin: 0;"
>
<img src="https://pikwizard.com/pw/medium/c4236b3180c134a3df61196ee7b93249.jpg" style="margin: 0; width: 100%;" alt="" />
<p style="font-size: 12px; margin: 0;">PikWizard</p>
</a>
</span>
</span>
Free (free of charge)
Free for personal and commercial use.
Author: People Creations
Similar Free Stock Images

Premium


Premium


Premium


Premium


Premium


Premium


Premium


Premium


Premium


Premium


Premium


Premium


Premium


Premium


Premium


Premium


Premium


Premium


Premium


Premium


Premium


Premium


Premium


Premium

