- Home >
- Stock Photos >
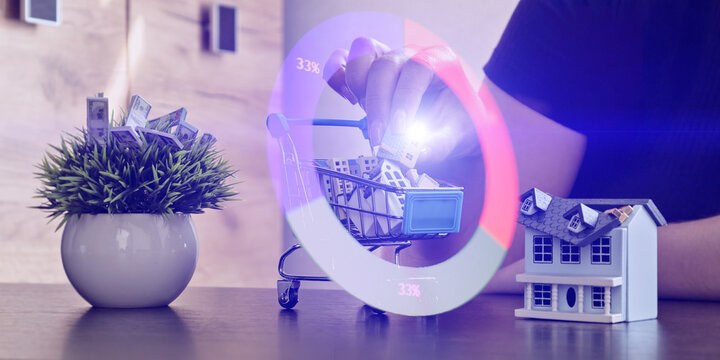
- Digital Financial Data Overlay on Shopping Cart Background
Digital Financial Data Overlay on Shopping Cart Background Image

This visually represents the intersection of the financial market and retail industry. The digital overlay of financial data mixed with the shopping cart makes it ideal for illustrating concepts of modern commerce, investment in retail, or the impact of economy on shopping behavior. Use it in financial reports, articles on economic trends, or discussions about technology's role in the retail industry.
Powered by 


2
downloads
downloads
Tags:
More
Credit Photo
If you would like to credit the Photo, here are some ways you can do so
Text Link
photo Link
<span class="text-link">
<span>
<a target="_blank" href=https://pikwizard.com/photo/digital-financial-data-overlay-on-shopping-cart-background/59615d1f22d75463f54c78976799e253/>PikWizard</a>
</span>
</span>
<span class="image-link">
<span
style="margin: 0 0 20px 0; display: inline-block; vertical-align: middle; width: 100%;"
>
<a
target="_blank"
href="https://pikwizard.com/photo/digital-financial-data-overlay-on-shopping-cart-background/59615d1f22d75463f54c78976799e253/"
style="text-decoration: none; font-size: 10px; margin: 0;"
>
<img src="https://pikwizard.com/pw/medium/59615d1f22d75463f54c78976799e253.jpg" style="margin: 0; width: 100%;" alt="" />
<p style="font-size: 12px; margin: 0;">PikWizard</p>
</a>
</span>
</span>
Free (free of charge)
Free for personal and commercial use.
Author: Awesome Content
Similar Free Stock Images

Premium


Premium


Premium


Premium


Premium


Premium


Premium


Premium


Premium


Premium


Premium


Premium


Premium


Premium


Premium


Premium


Premium


Premium


Premium


Premium


Premium


Premium


Premium


Premium