- Home >
- Stock Photos >
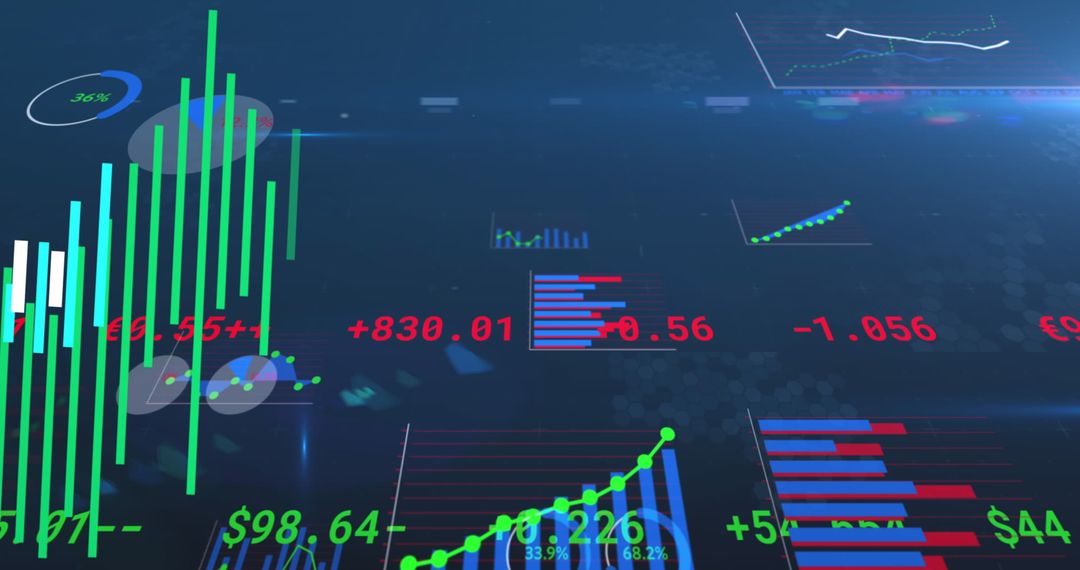
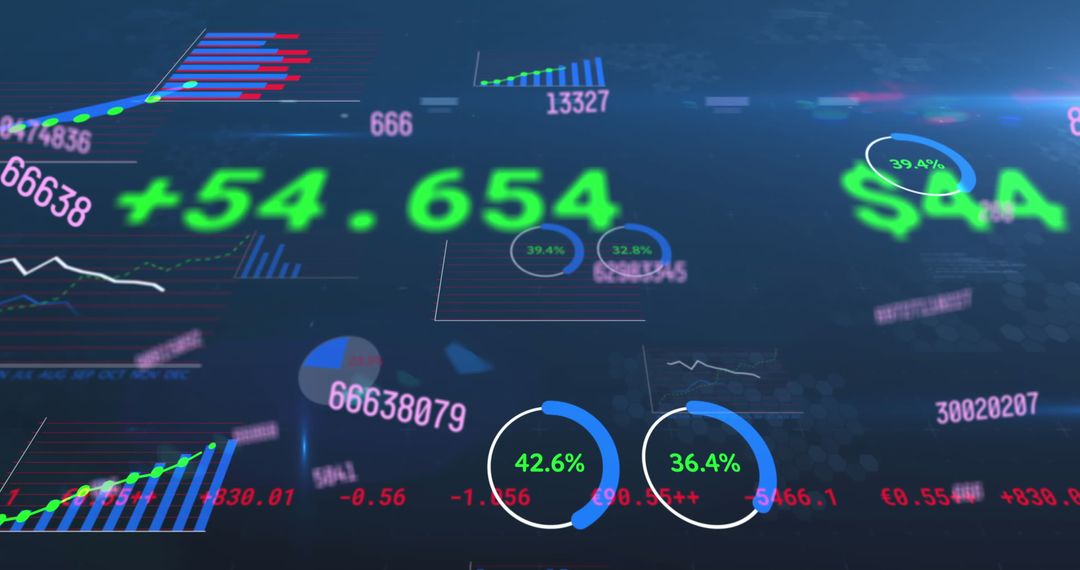
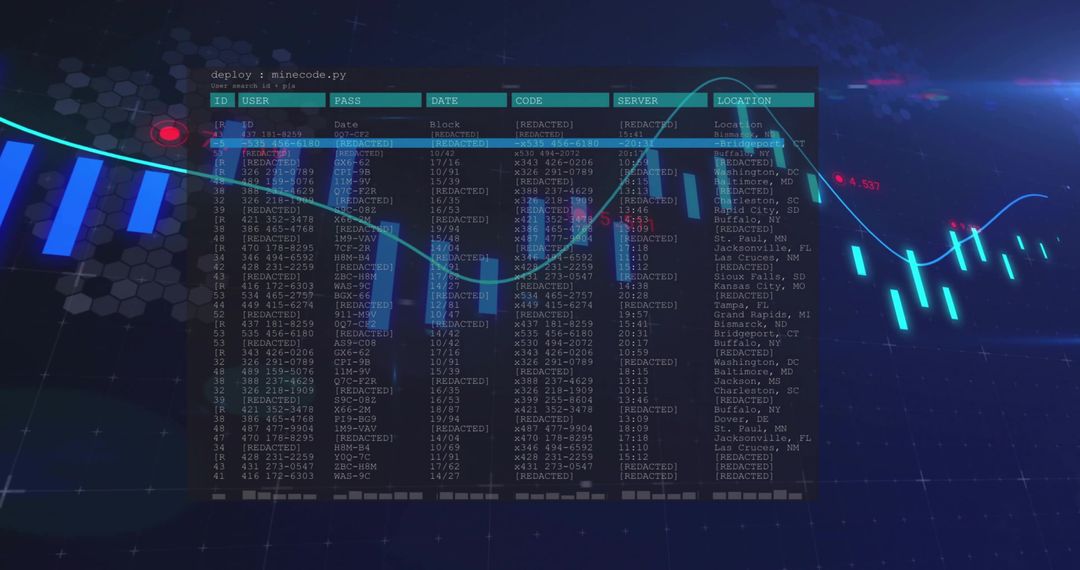
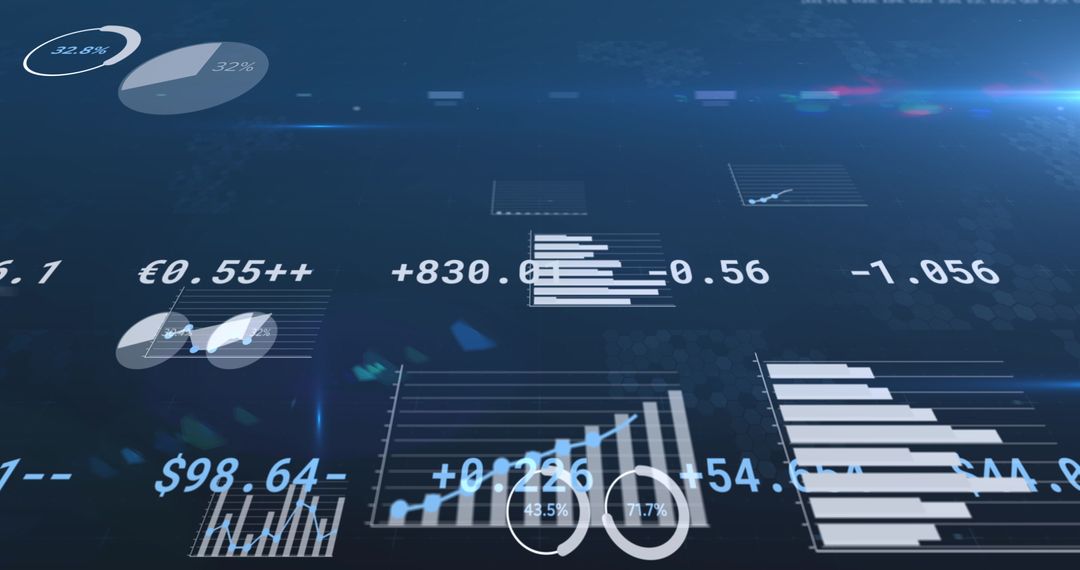
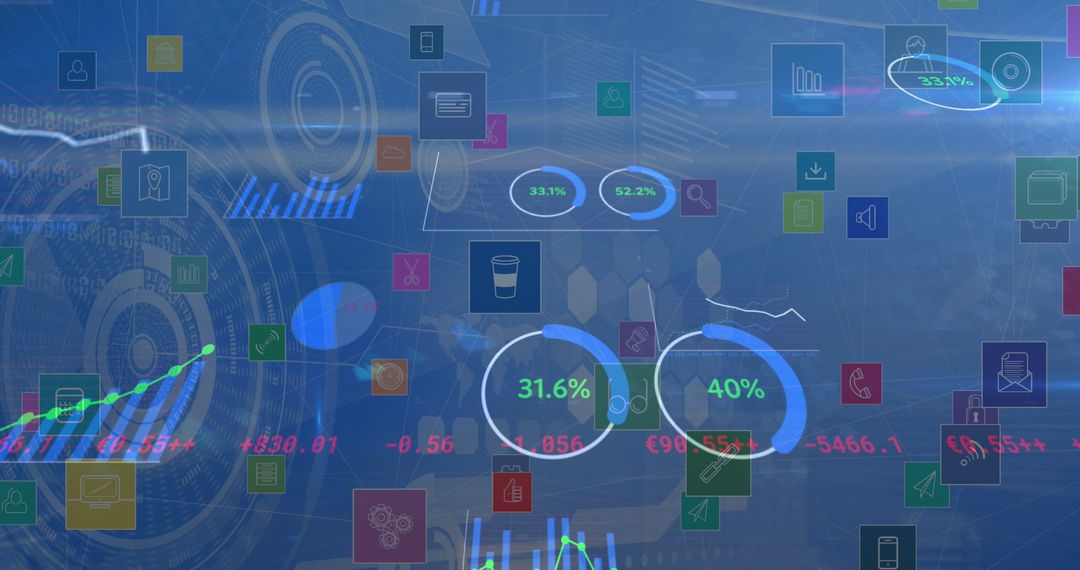
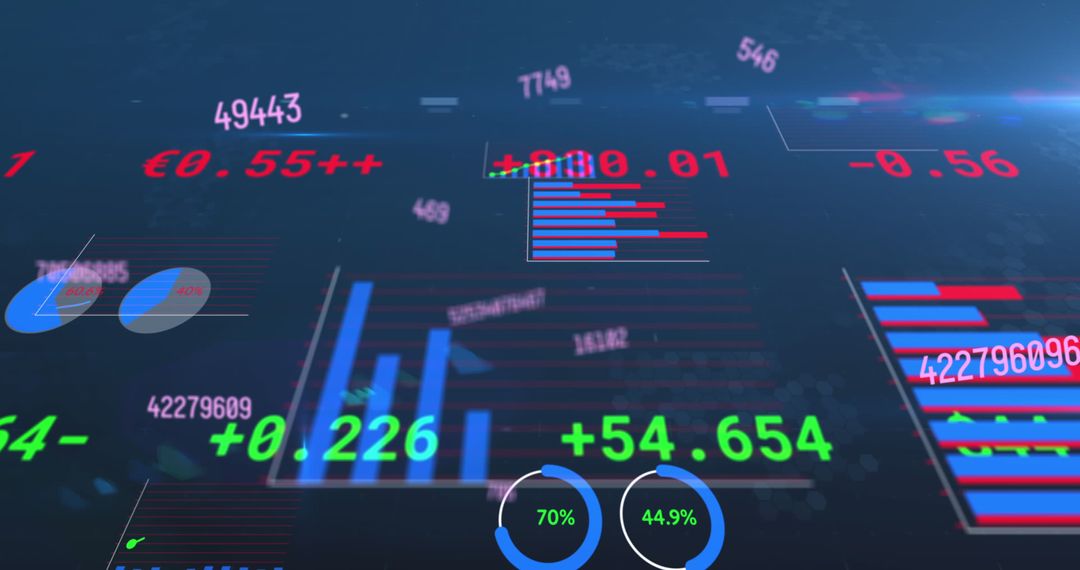
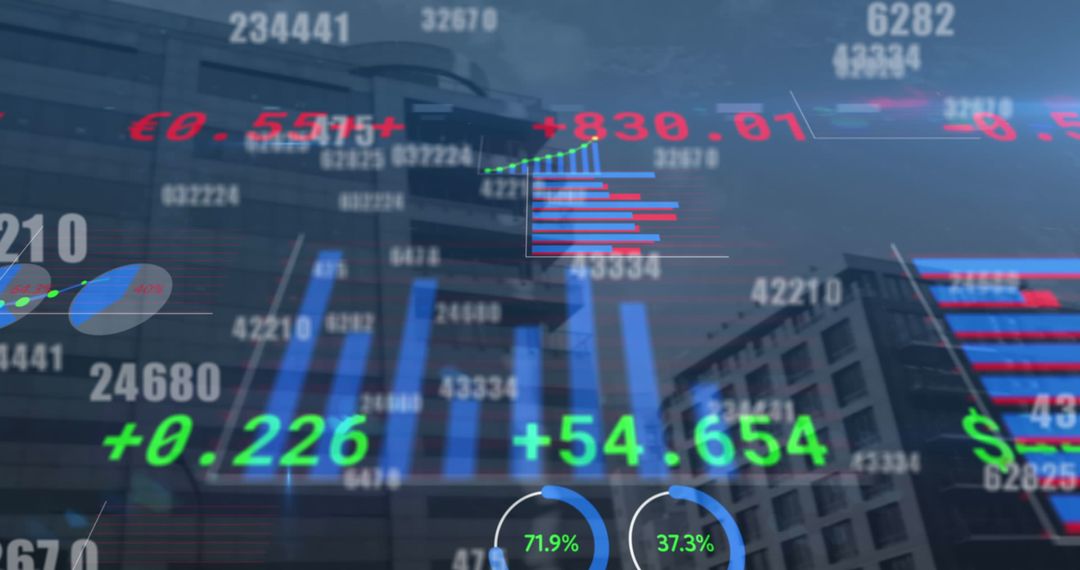
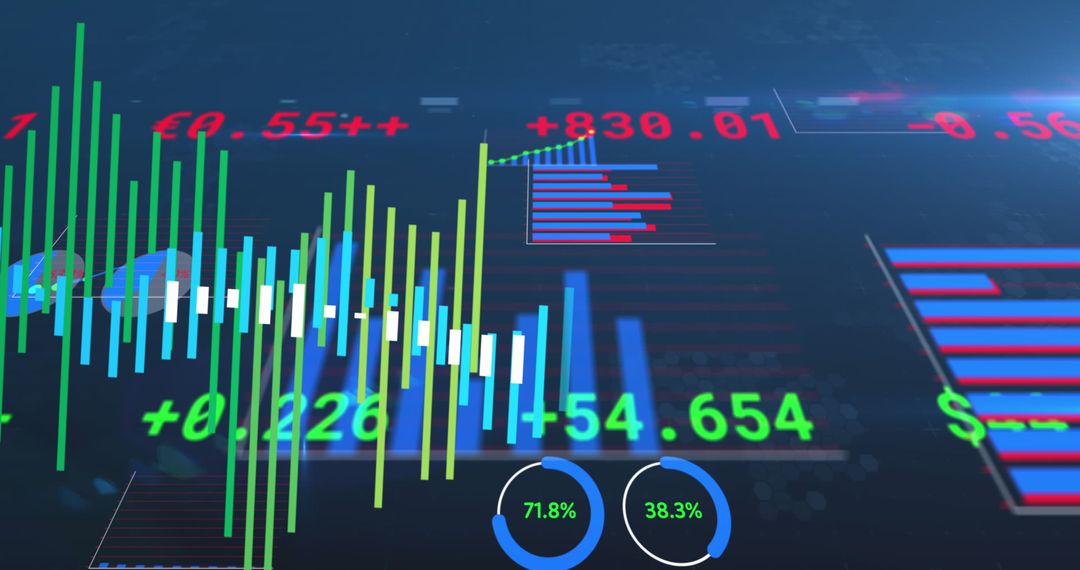
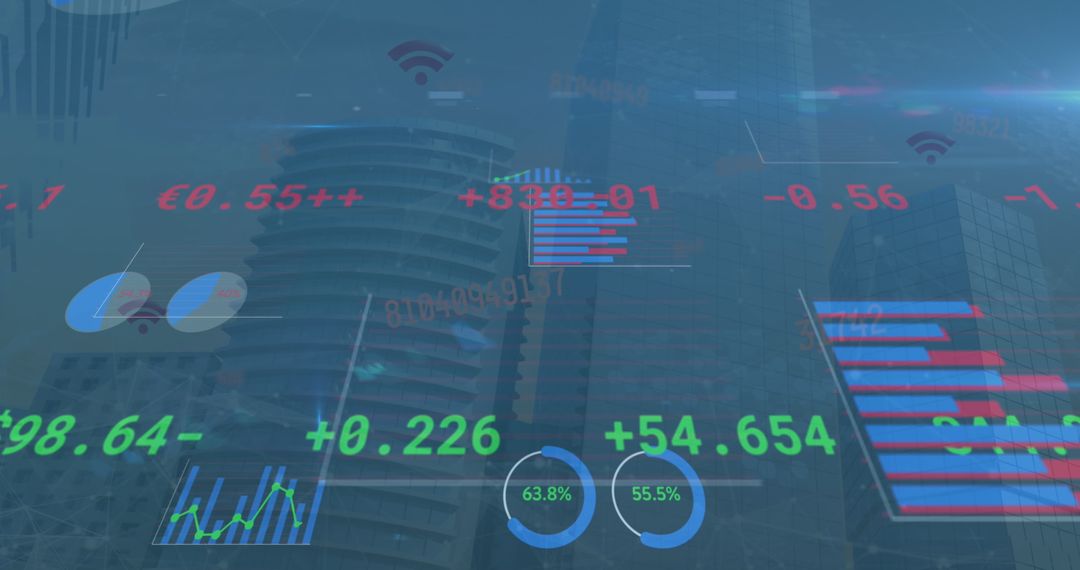
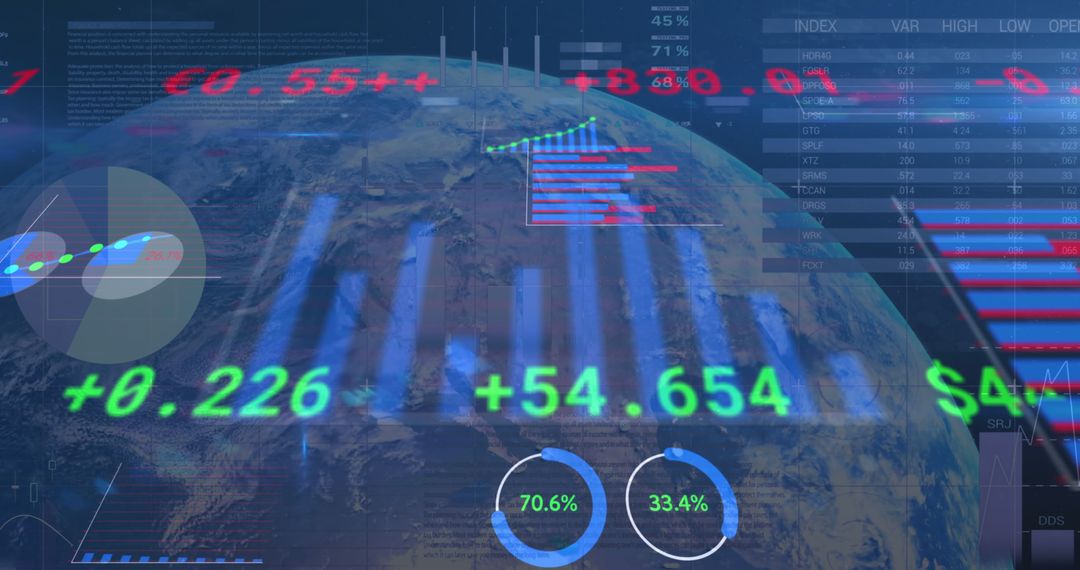
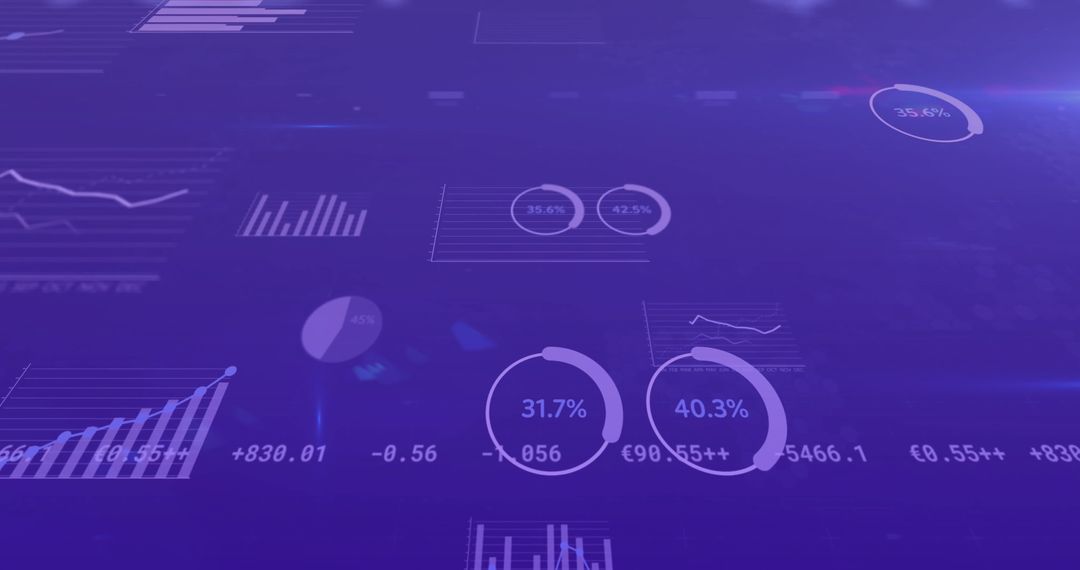
- Digital Financial Data Stock Market Analytics Display
Digital Financial Data Stock Market Analytics Display Image

Charts and figures display on a dark digital interface, representing financial data processing and stock market analytics. Suitable for presentations, reports, and articles about finance, technology-driven analytics, and capitional template ideas related to stock trading, investment analysis, and digital finance platforms.
Powered by  - Get 15% off with code: PIKWIZARD15


2
downloads
downloads
Tags:
More
Credit Photo
If you would like to credit the Photo, here are some ways you can do so
Text Link
photo Link
<span class="text-link">
<span>
<a target="_blank" href=https://pikwizard.com/photo/digital-financial-data-stock-market-analytics-display/043d2127fb02dea380d46f3a017f741e/>PikWizard</a>
</span>
</span>
<span class="image-link">
<span
style="margin: 0 0 20px 0; display: inline-block; vertical-align: middle; width: 100%;"
>
<a
target="_blank"
href="https://pikwizard.com/photo/digital-financial-data-stock-market-analytics-display/043d2127fb02dea380d46f3a017f741e/"
style="text-decoration: none; font-size: 10px; margin: 0;"
>
<img src="https://pikwizard.com/pw/medium/043d2127fb02dea380d46f3a017f741e.jpg" style="margin: 0; width: 100%;" alt="" />
<p style="font-size: 12px; margin: 0;">PikWizard</p>
</a>
</span>
</span>
Free (free of charge)
Free for personal and commercial use.
Author: Creative Art
Similar Free Stock Images

Premium


Premium


Premium


Premium


Premium


Premium


Premium


Premium


Premium


Premium


Premium


Premium


Premium


Premium


Premium


Premium


Premium


Premium


Premium


Premium


Premium


Premium


Premium


Premium