- Home >
- Stock Photos >
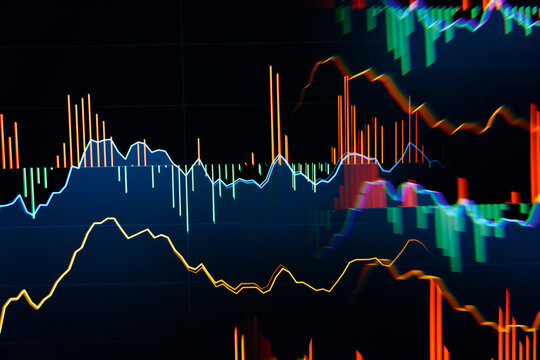
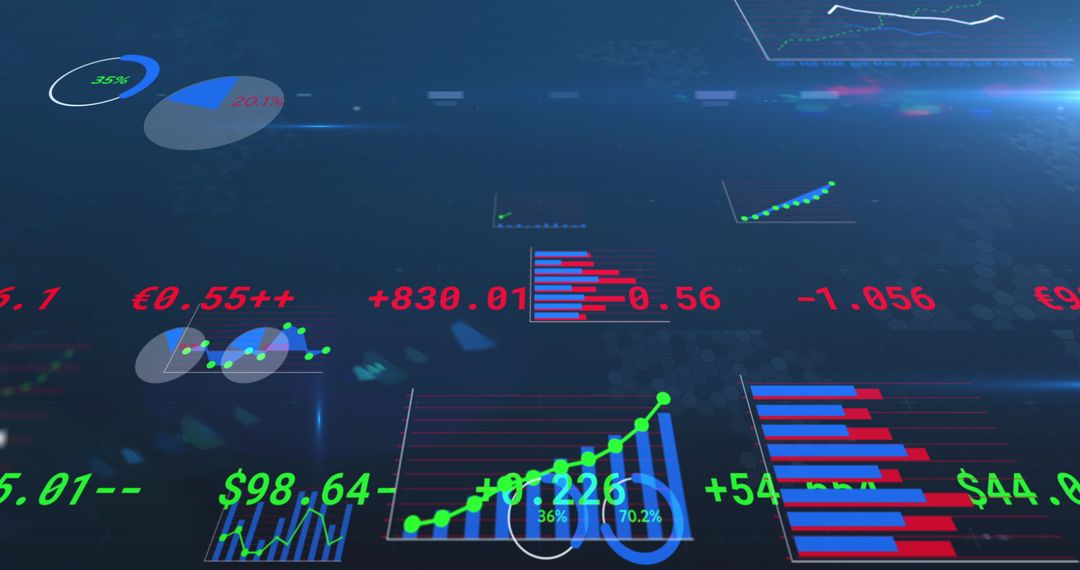
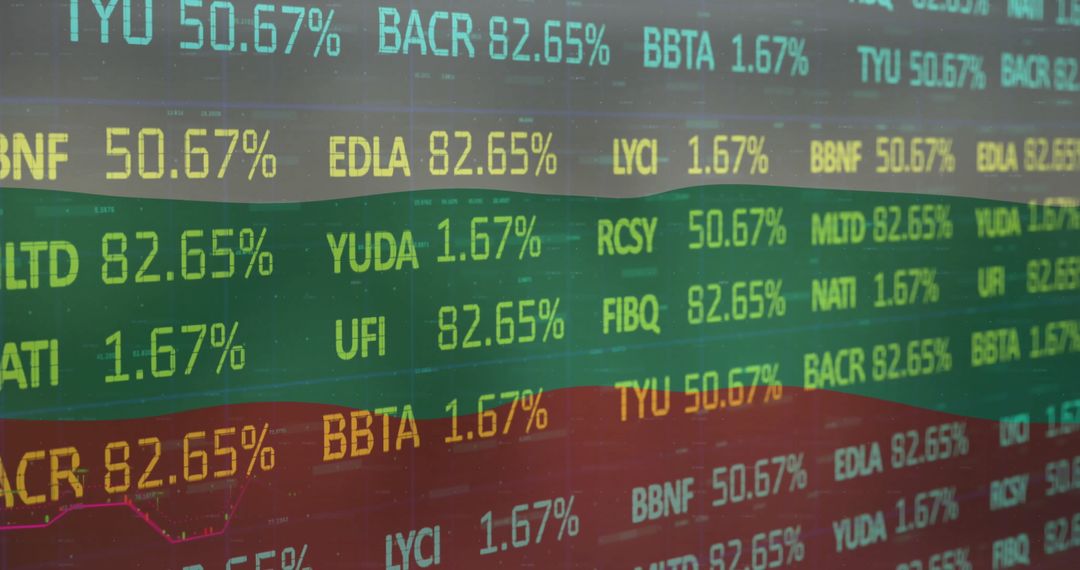
- Digital Financial Data Visualization with Red and Yellow Highlights
Digital Financial Data Visualization with Red and Yellow Highlights Image

Dynamic visualization of financial data displayed digitally in bright red and yellow text, illustrating stock market trends and analysis. Useful for articles and presentations focused on global economic insights, business finance management, or investment strategy discussions.
Powered by 


2
downloads
downloads
Tags:
More
Credit Photo
If you would like to credit the Photo, here are some ways you can do so
Text Link
photo Link
<span class="text-link">
<span>
<a target="_blank" href=https://pikwizard.com/photo/digital-financial-data-visualization-with-red-and-yellow-highlights/5d786f5c440790495e0f761dd1670f71/>PikWizard</a>
</span>
</span>
<span class="image-link">
<span
style="margin: 0 0 20px 0; display: inline-block; vertical-align: middle; width: 100%;"
>
<a
target="_blank"
href="https://pikwizard.com/photo/digital-financial-data-visualization-with-red-and-yellow-highlights/5d786f5c440790495e0f761dd1670f71/"
style="text-decoration: none; font-size: 10px; margin: 0;"
>
<img src="https://pikwizard.com/pw/medium/5d786f5c440790495e0f761dd1670f71.jpg" style="margin: 0; width: 100%;" alt="" />
<p style="font-size: 12px; margin: 0;">PikWizard</p>
</a>
</span>
</span>
Free (free of charge)
Free for personal and commercial use.
Author: People Creations
Similar Free Stock Images

Premium


Premium


Premium


Premium


Premium


Premium


Premium


Premium


Premium


Premium


Premium


Premium


Premium


Premium


Premium


Premium


Premium


Premium


Premium


Premium


Premium


Premium


Premium


Premium