- Home >
- Stock Photos >
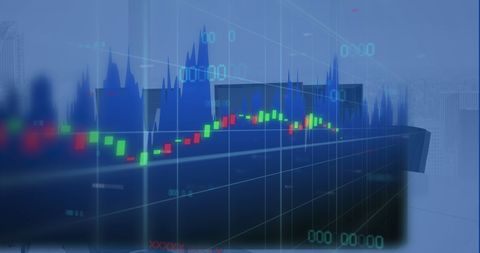
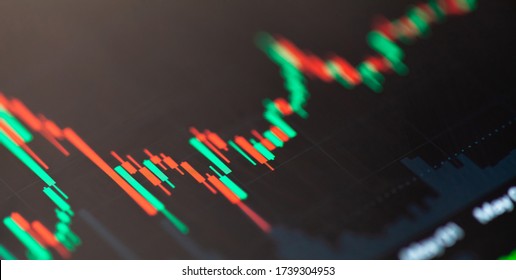
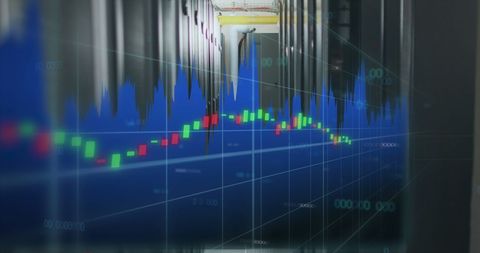
- Digital Financial Data Visualization with Stock Market Charts
Digital Financial Data Visualization with Stock Market Charts Image

The image shows an advanced financial data visualization with candlestick and area charts projected against a digital background. The glowing blue hue suggests a high-tech environment, highlighting the emphasis on data analytics and market trends. This is ideal for use in financial sites, presentations on stock markets, analysis reports, or educational materials focusing on economic forecasting and investment strategies.
Powered by  - Get 15% off with code: PIKWIZARD15


2
downloads
downloads
Tags:
More
Credit Photo
If you would like to credit the Photo, here are some ways you can do so
Text Link
photo Link
<span class="text-link">
<span>
<a target="_blank" href=https://pikwizard.com/photo/digital-financial-data-visualization-with-stock-market-charts/7272b872565aef110e493789f38414a5/>PikWizard</a>
</span>
</span>
<span class="image-link">
<span
style="margin: 0 0 20px 0; display: inline-block; vertical-align: middle; width: 100%;"
>
<a
target="_blank"
href="https://pikwizard.com/photo/digital-financial-data-visualization-with-stock-market-charts/7272b872565aef110e493789f38414a5/"
style="text-decoration: none; font-size: 10px; margin: 0;"
>
<img src="https://pikwizard.com/pw/medium/7272b872565aef110e493789f38414a5.jpg" style="margin: 0; width: 100%;" alt="" />
<p style="font-size: 12px; margin: 0;">PikWizard</p>
</a>
</span>
</span>
Free (free of charge)
Free for personal and commercial use.
Author: Authentic Images
Similar Free Stock Images

Premium


Premium


Premium


Premium


Premium


Premium


Premium


Premium


Premium


Premium


Premium


Premium


Premium


Premium


Premium


Premium


Premium


Premium


Premium


Premium


Premium


Premium


Premium


Premium


Premium