- Home >
- Stock Photos >
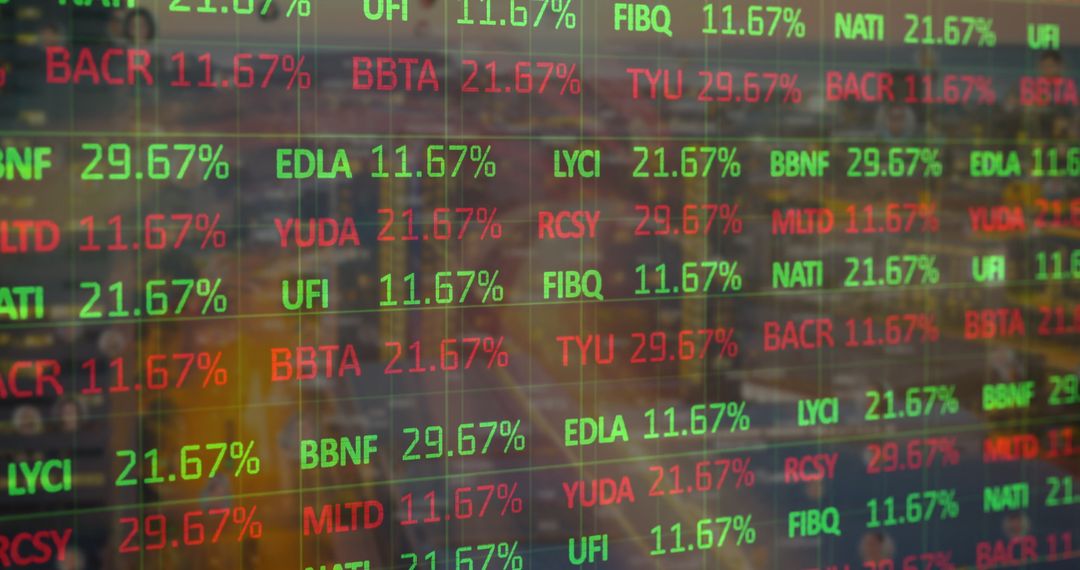
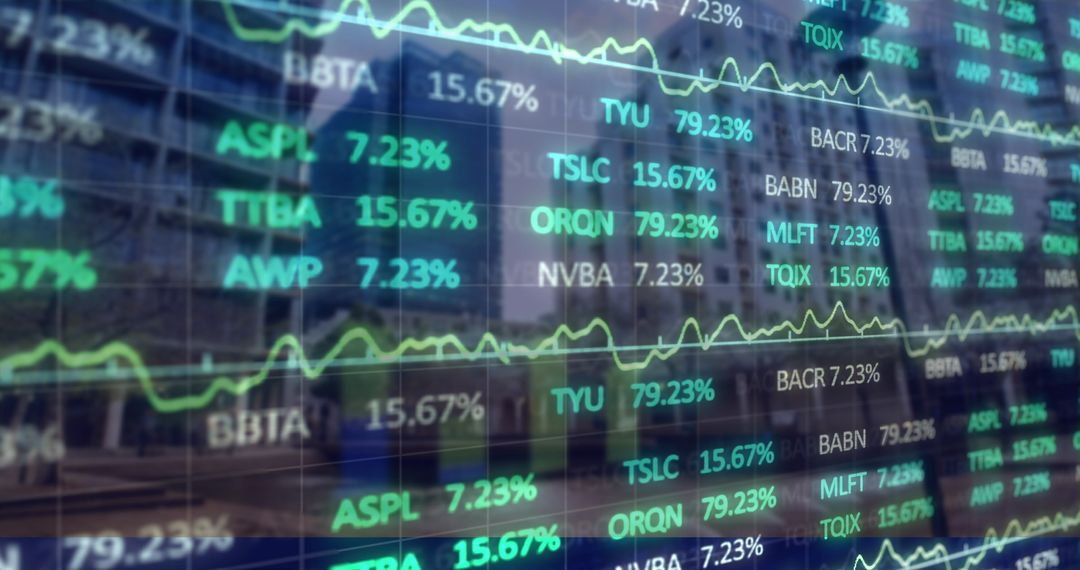
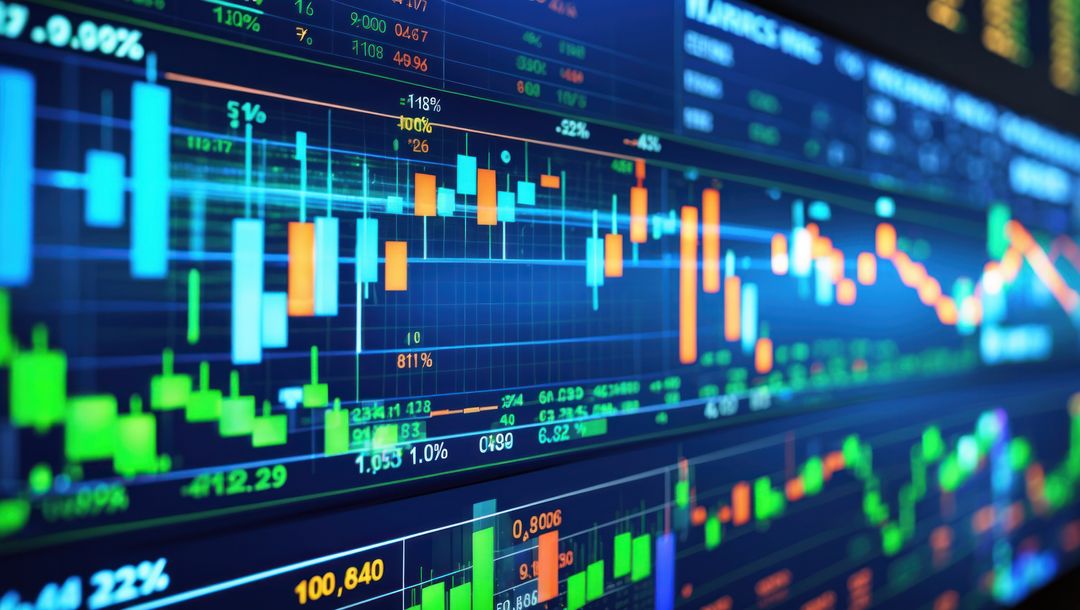
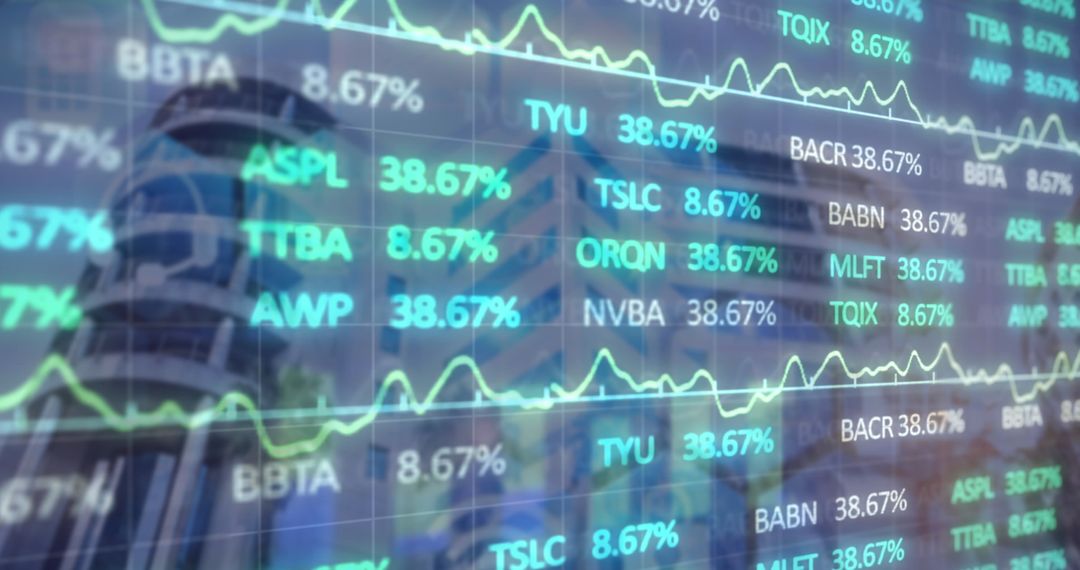
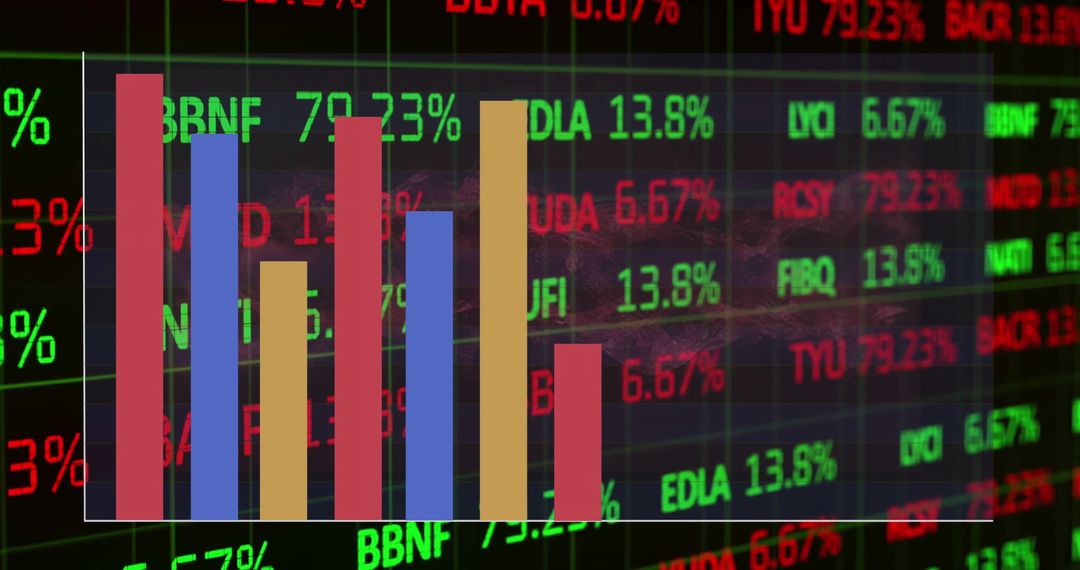
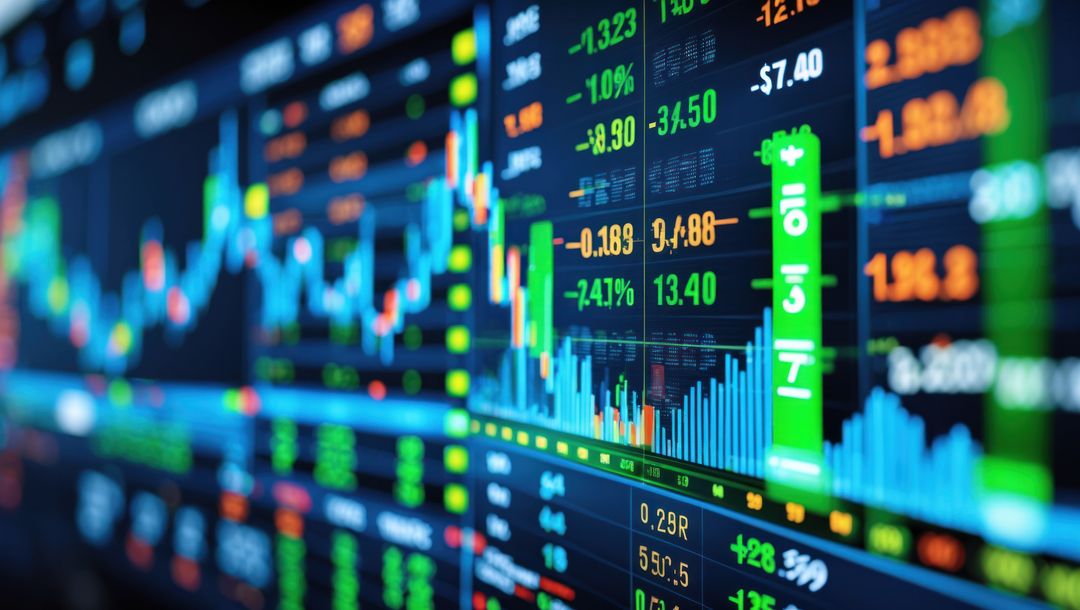
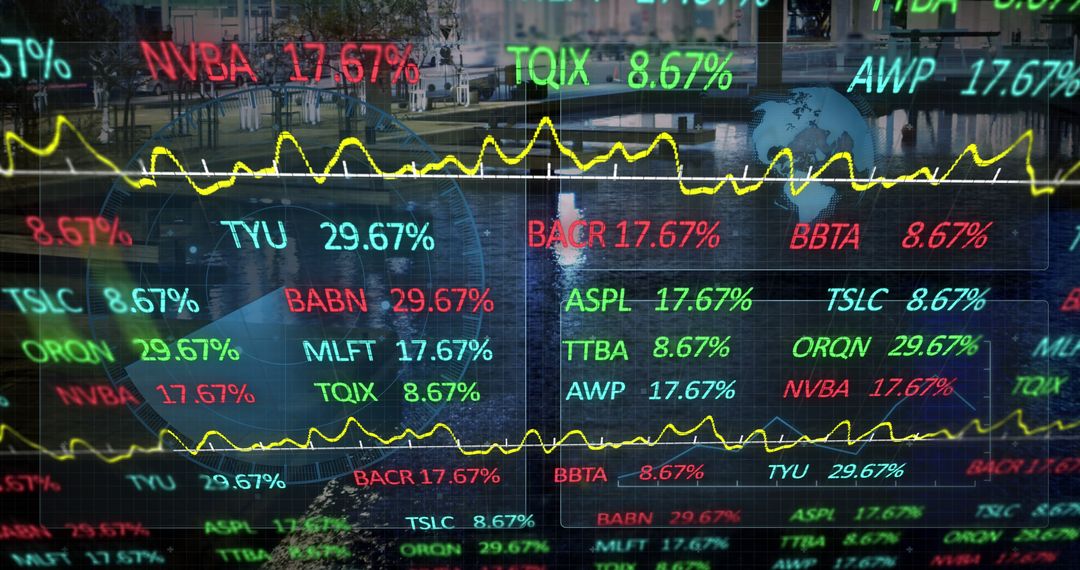
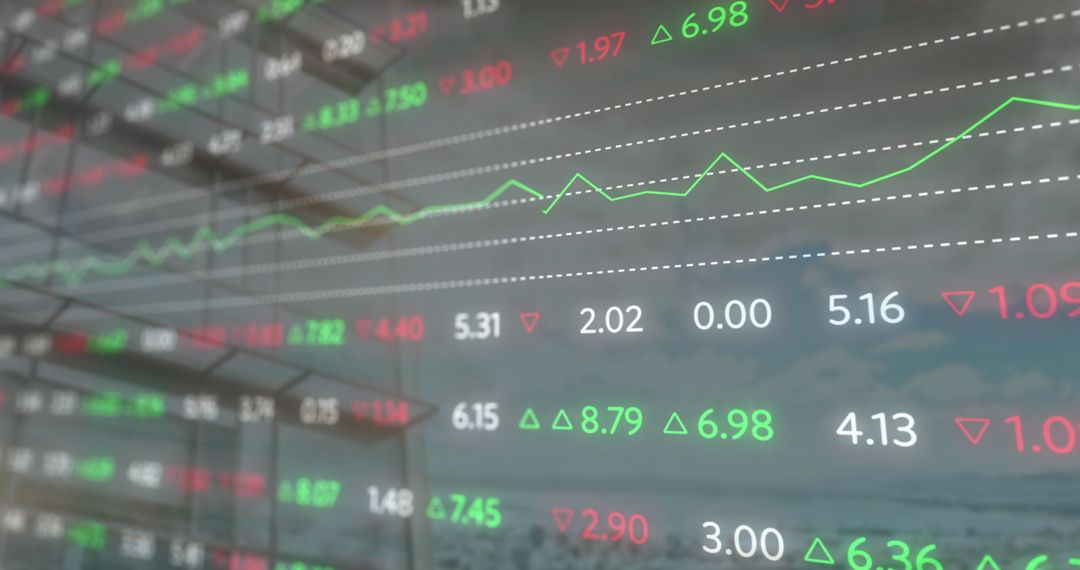
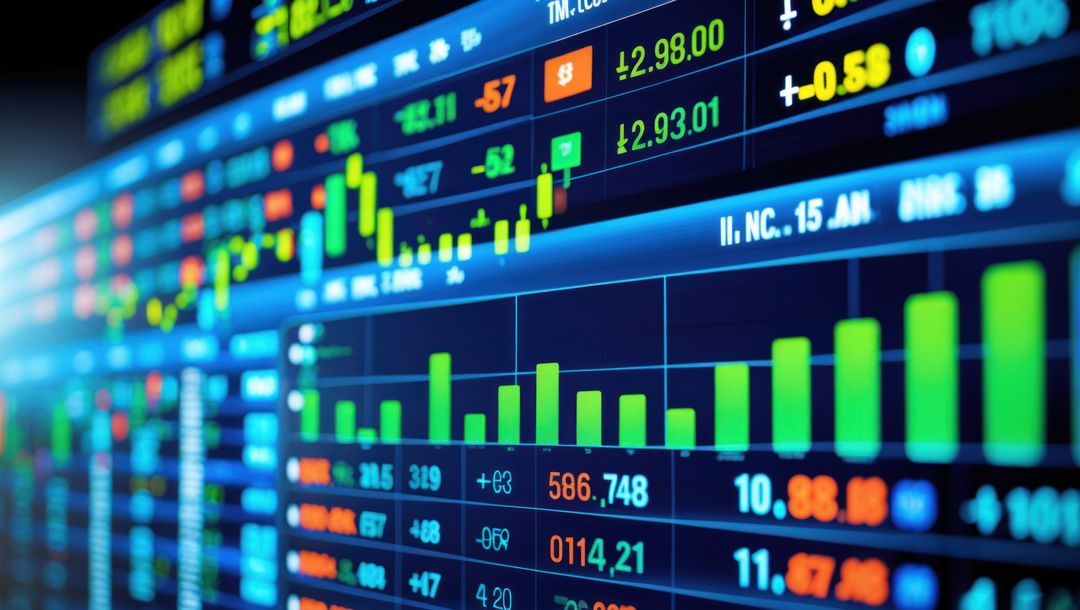
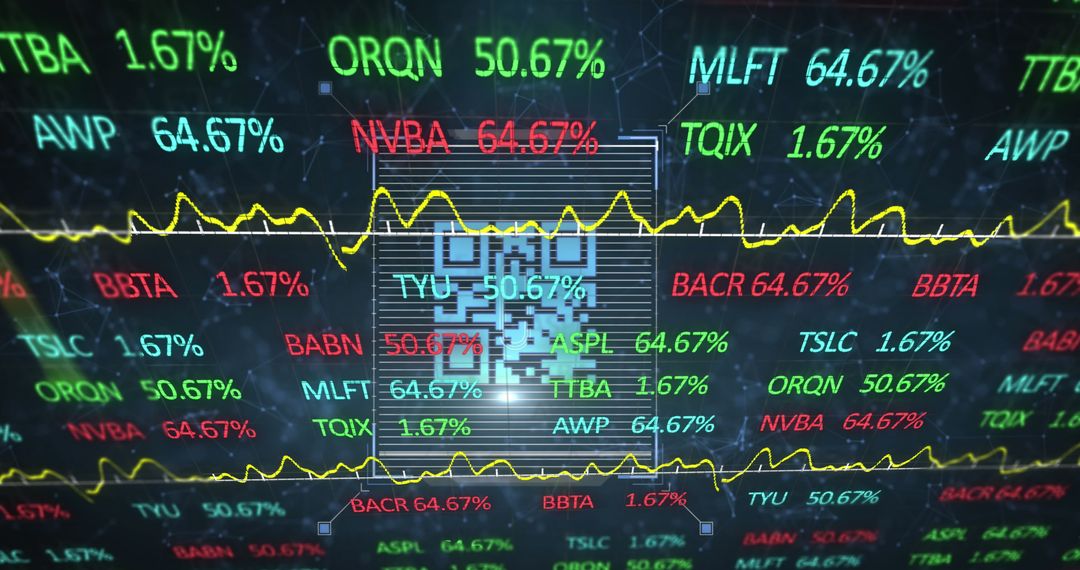
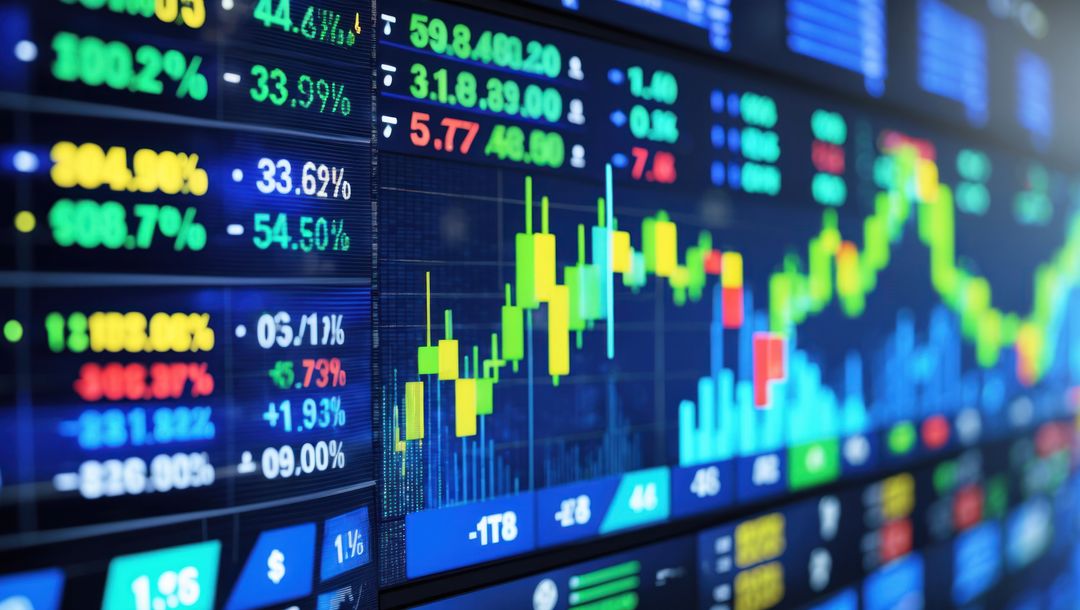
- Digital Financial Trading Analytics Dashboard with Graphs and Data
Digital Financial Trading Analytics Dashboard with Graphs and Data Image
AI Generated Image. This close-up displays a financial trading interface with bar charts and percentage data, making it ideal for illustrating articles about stock market trading, digital analytics, financial technology, and business forecasting. Suitable for web pages focusing on technology integration in finance or market analysis platforms.
Powered by  - Get 15% off with code: PIKWIZARD15


4
downloads
downloads
Tags:
More
Credit Photo
If you would like to credit the Photo, here are some ways you can do so
Text Link
photo Link
<span class="text-link">
<span>
<a target="_blank" href=https://pikwizard.com/photo/digital-financial-trading-analytics-dashboard-with-graphs-and-data/f74404e79cb7740920bea98c11e046d6/>PikWizard</a>
</span>
</span>
<span class="image-link">
<span
style="margin: 0 0 20px 0; display: inline-block; vertical-align: middle; width: 100%;"
>
<a
target="_blank"
href="https://pikwizard.com/photo/digital-financial-trading-analytics-dashboard-with-graphs-and-data/f74404e79cb7740920bea98c11e046d6/"
style="text-decoration: none; font-size: 10px; margin: 0;"
>
<img src="https://pikwizard.com/pw/medium/f74404e79cb7740920bea98c11e046d6.jpg" style="margin: 0; width: 100%;" alt="" />
<p style="font-size: 12px; margin: 0;">PikWizard</p>
</a>
</span>
</span>
Free (free of charge)
Free for personal and commercial use.
Author: AI Creator
Similar Free Stock Images

Premium


Premium


Premium


Premium


Premium


Premium

Premium


Premium


Premium


Premium


Premium


Premium


Premium


Premium


Premium


Premium


Premium


Premium


Premium


Premium


Premium


Premium


Premium


Premium