- Home >
- Stock Photos >
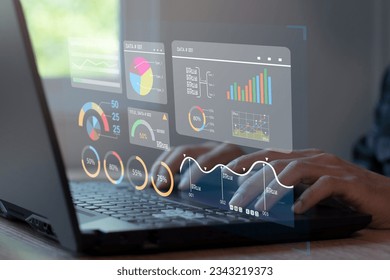
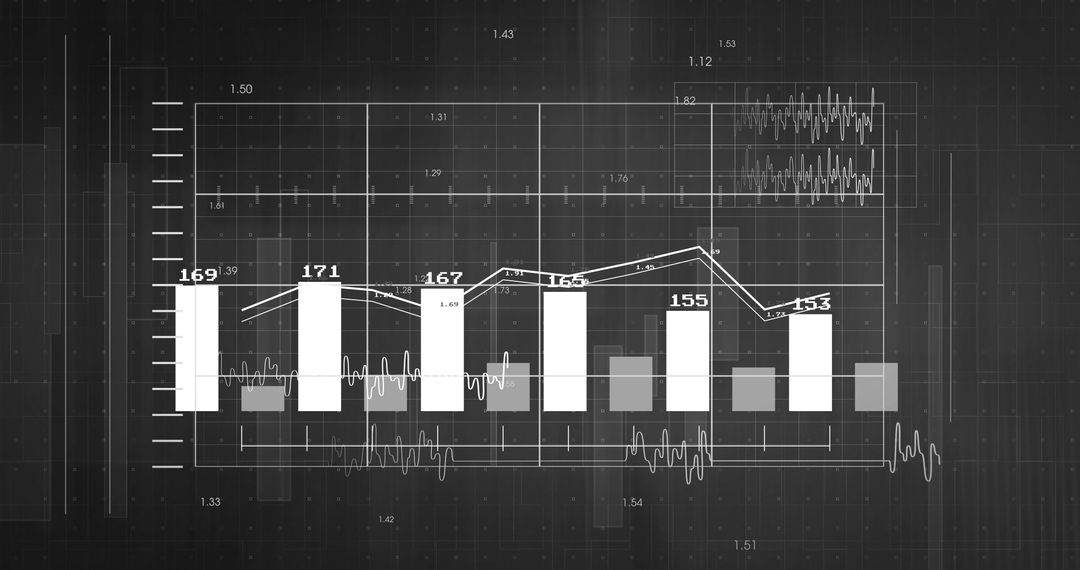
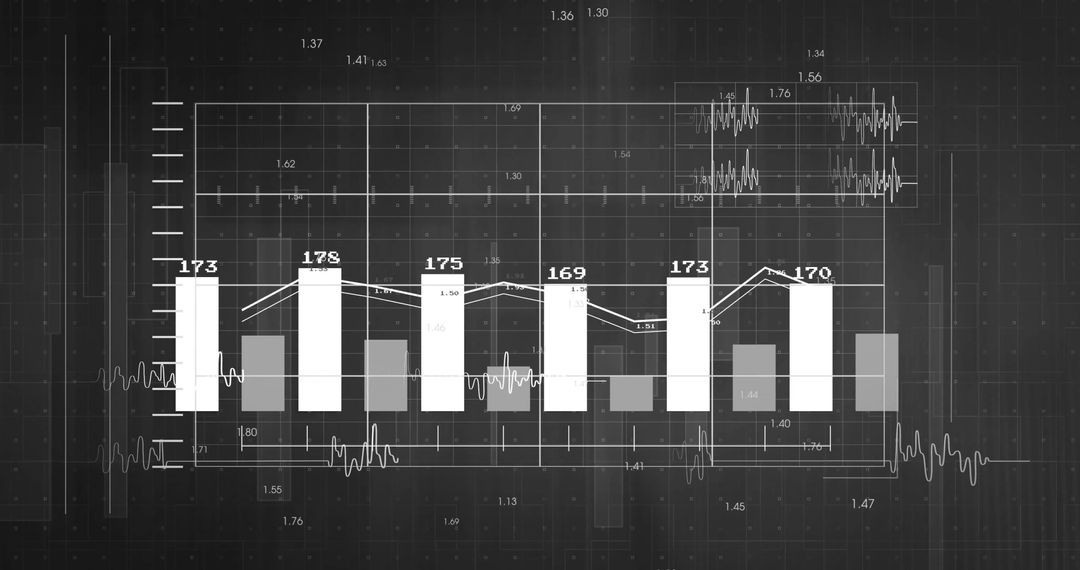
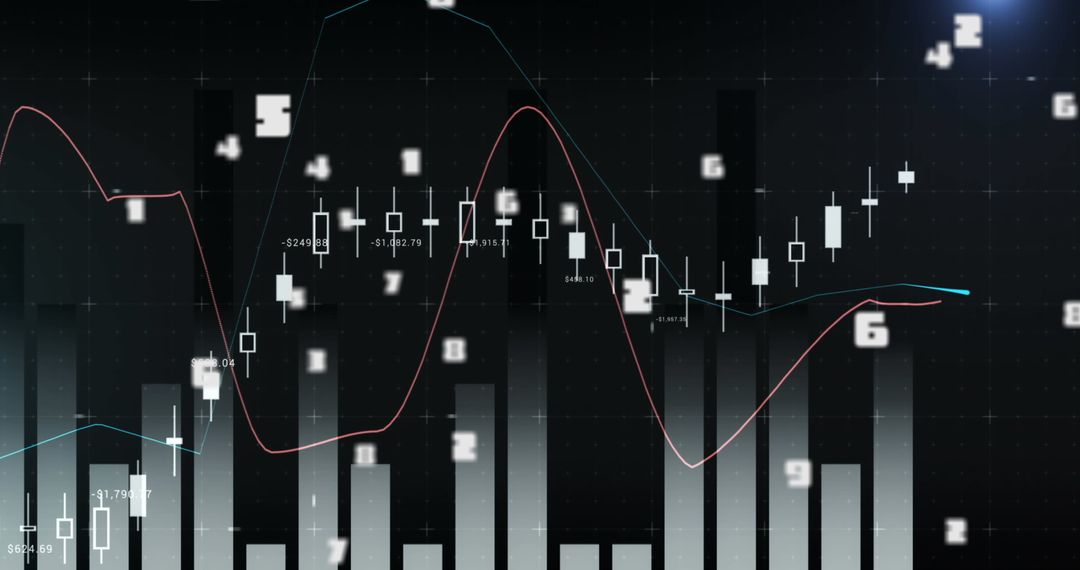
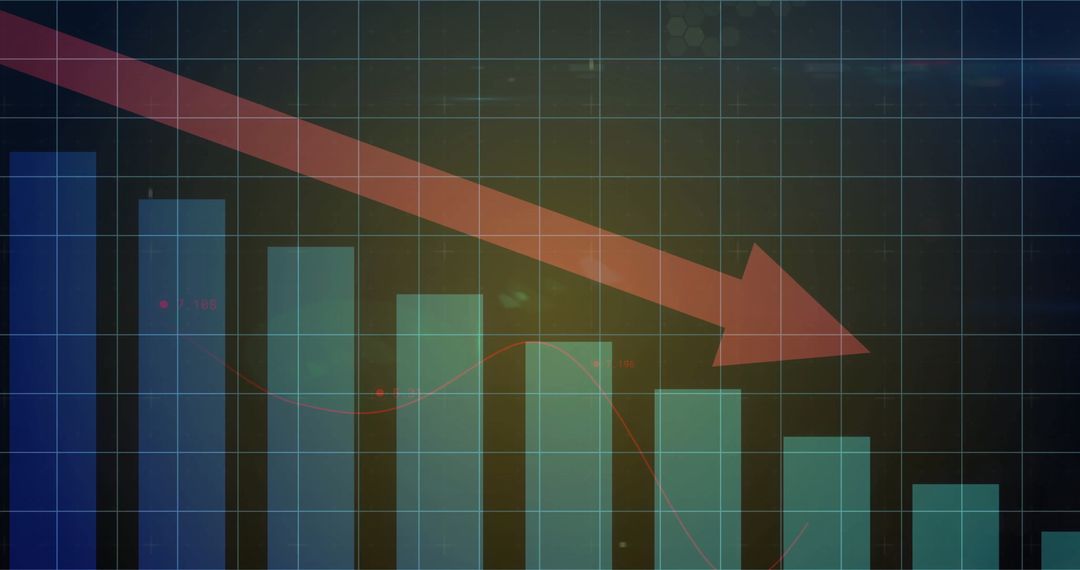
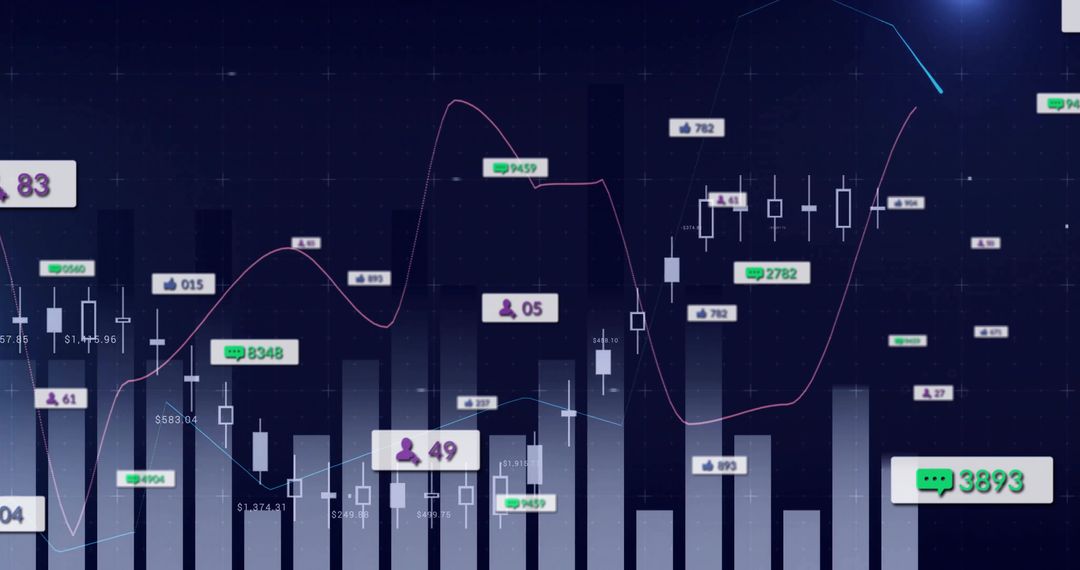
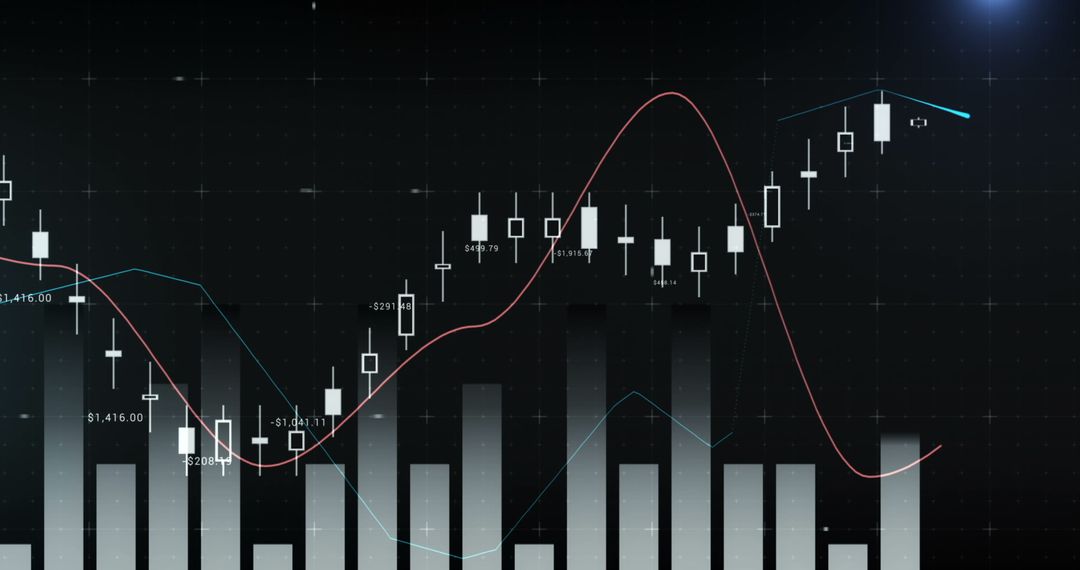
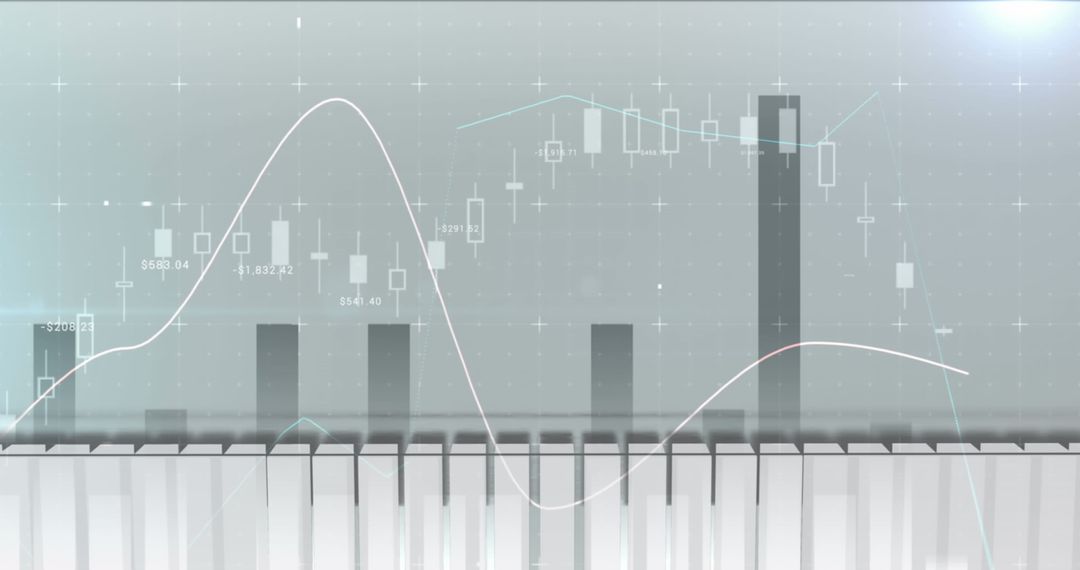
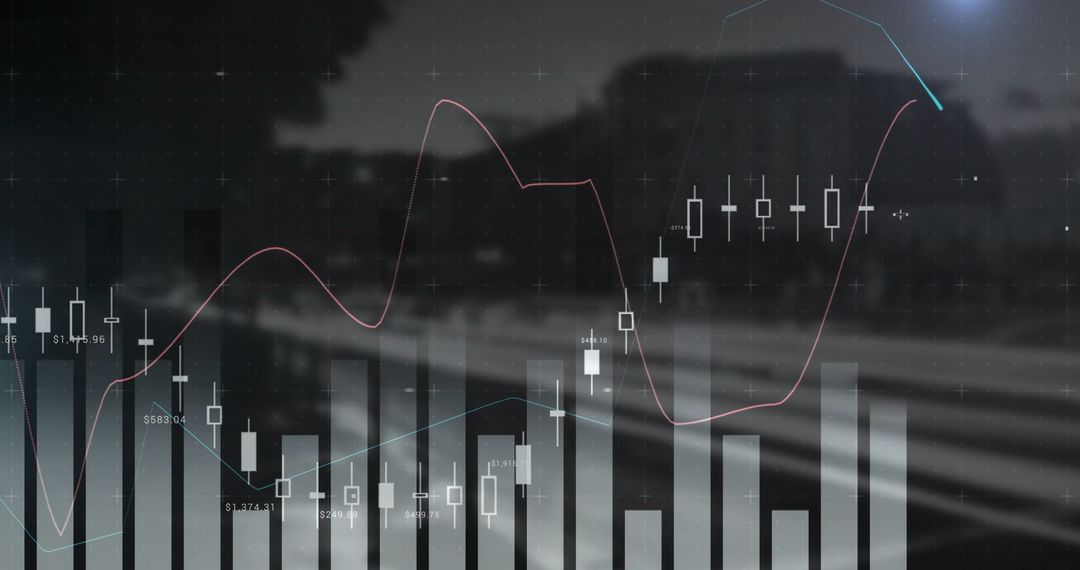
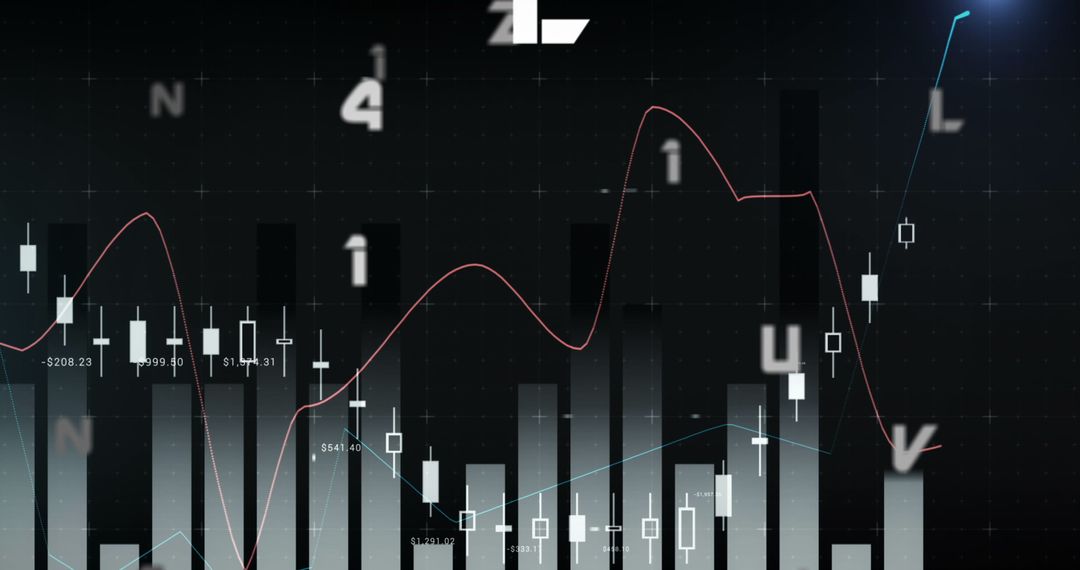
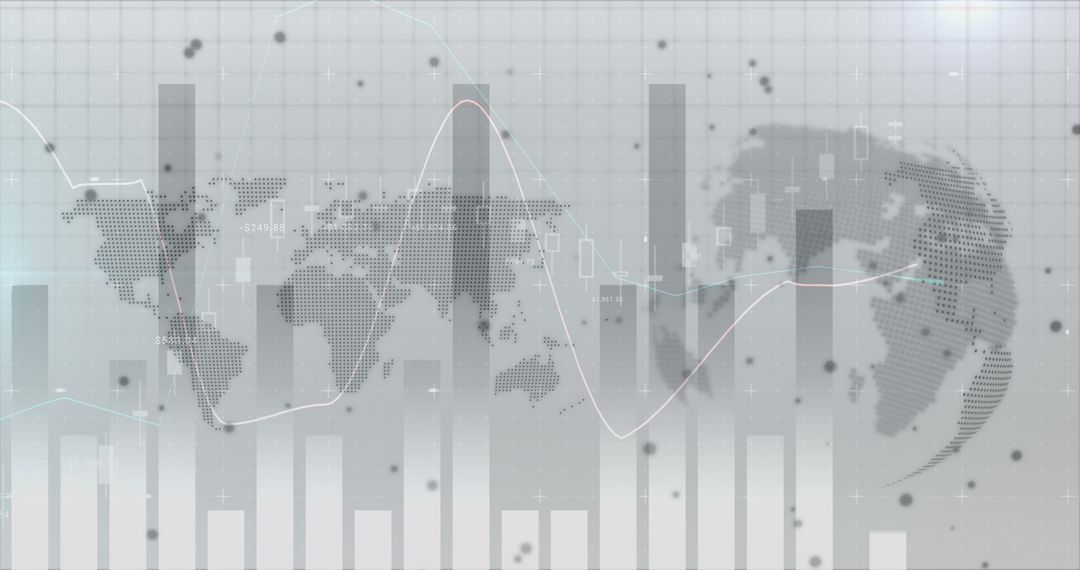
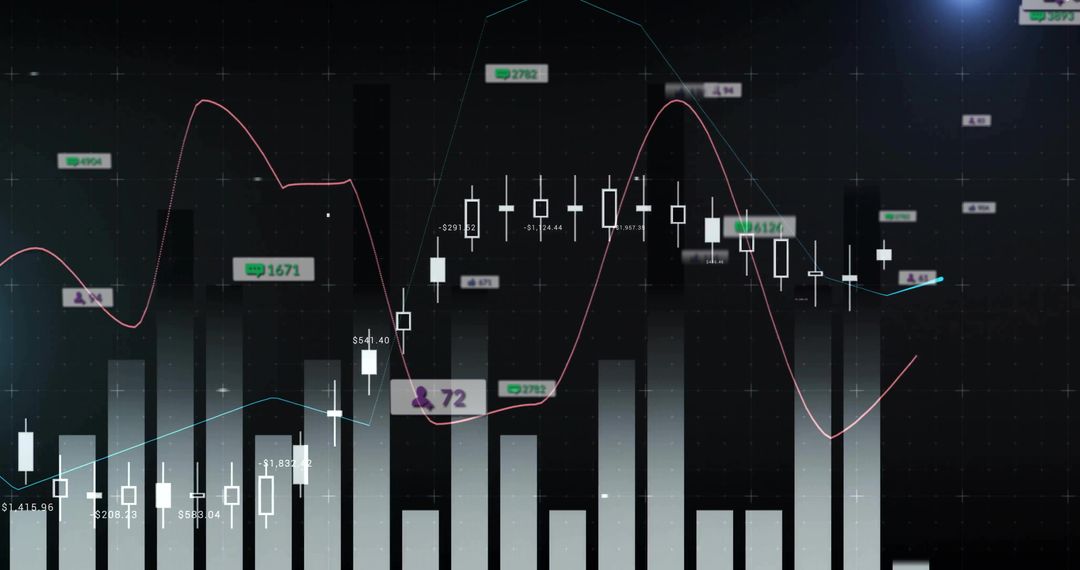
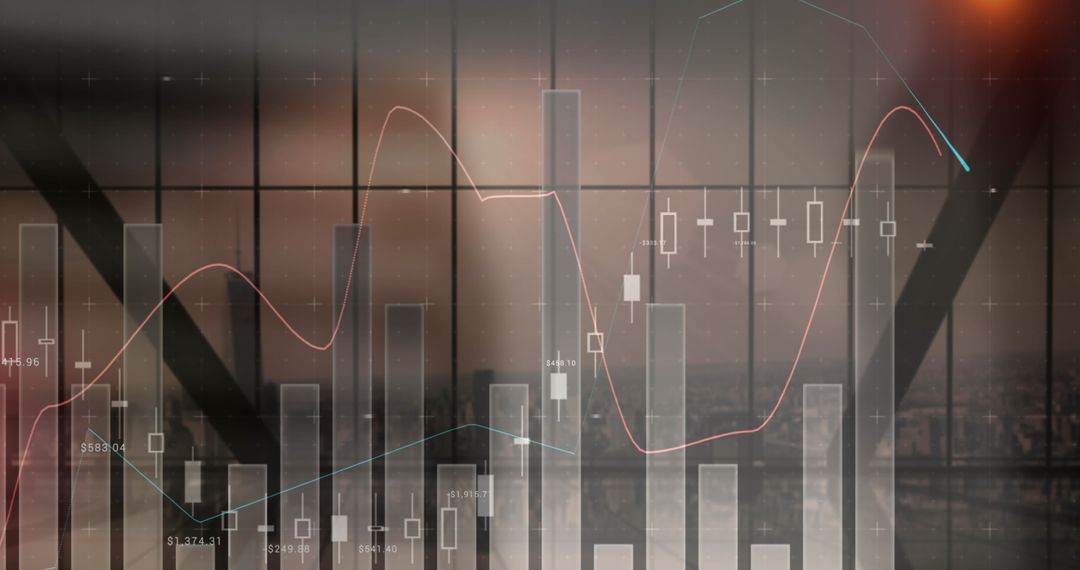
- Digital Financial Trading Dashboard with Candlestick and Bar Graphs
Digital Financial Trading Dashboard with Candlestick and Bar Graphs Image
Advanced digital trading dashboard displays real-time data visualization. Key elements include candlestick charts, histogram bars, and line graphs for finance and analytics. Useful for financial presentations, investment guides, trading platforms, or educational purposes in technology and economics.
Powered by  - Get 15% off with code: PIKWIZARD15


0
downloads
downloads
Tags:
More
Credit Photo
If you would like to credit the Photo, here are some ways you can do so
Text Link
photo Link
<span class="text-link">
<span>
<a target="_blank" href=https://pikwizard.com/photo/digital-financial-trading-dashboard-with-candlestick-and-bar-graphs/193b22f7d42d2a2325b42ab3f480c0dc/>PikWizard</a>
</span>
</span>
<span class="image-link">
<span
style="margin: 0 0 20px 0; display: inline-block; vertical-align: middle; width: 100%;"
>
<a
target="_blank"
href="https://pikwizard.com/photo/digital-financial-trading-dashboard-with-candlestick-and-bar-graphs/193b22f7d42d2a2325b42ab3f480c0dc/"
style="text-decoration: none; font-size: 10px; margin: 0;"
>
<img src="https://pikwizard.com/pw/medium/193b22f7d42d2a2325b42ab3f480c0dc.jpg" style="margin: 0; width: 100%;" alt="" />
<p style="font-size: 12px; margin: 0;">PikWizard</p>
</a>
</span>
</span>
Free (free of charge)
Free for personal and commercial use.
Author: Creative Art
Similar Free Stock Images
Premium


Premium


Premium


Premium


Premium


Premium


Premium


Premium


Premium


Premium


Premium


Premium


Premium


Premium


Premium


Premium


Premium


Premium


Premium


Premium


Premium


Premium


Premium


Premium