1. Home > 
  2. Stock Photos > 
  3. Digital Global Finance Economy Data Visualization

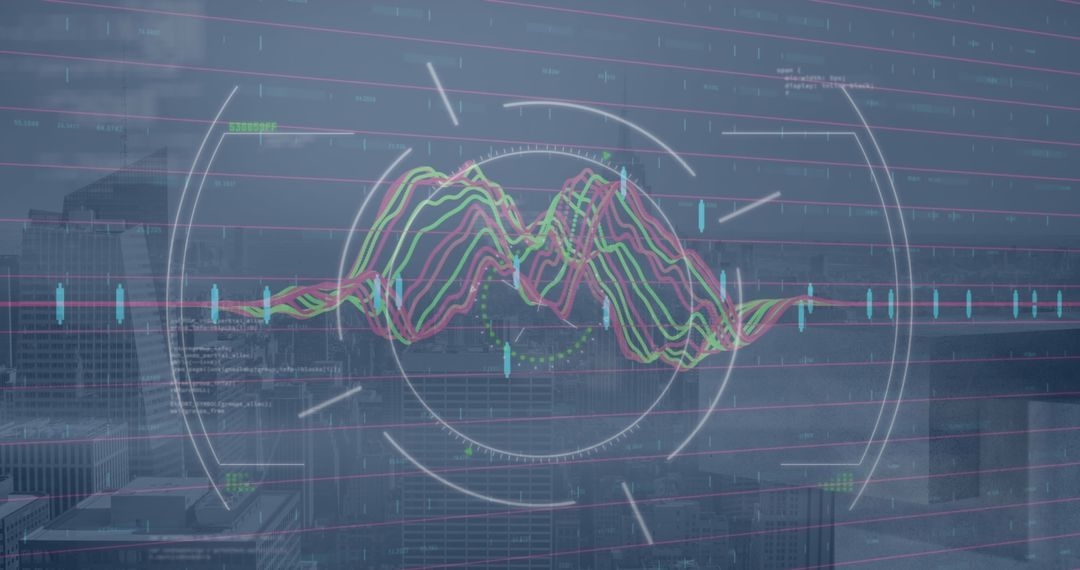
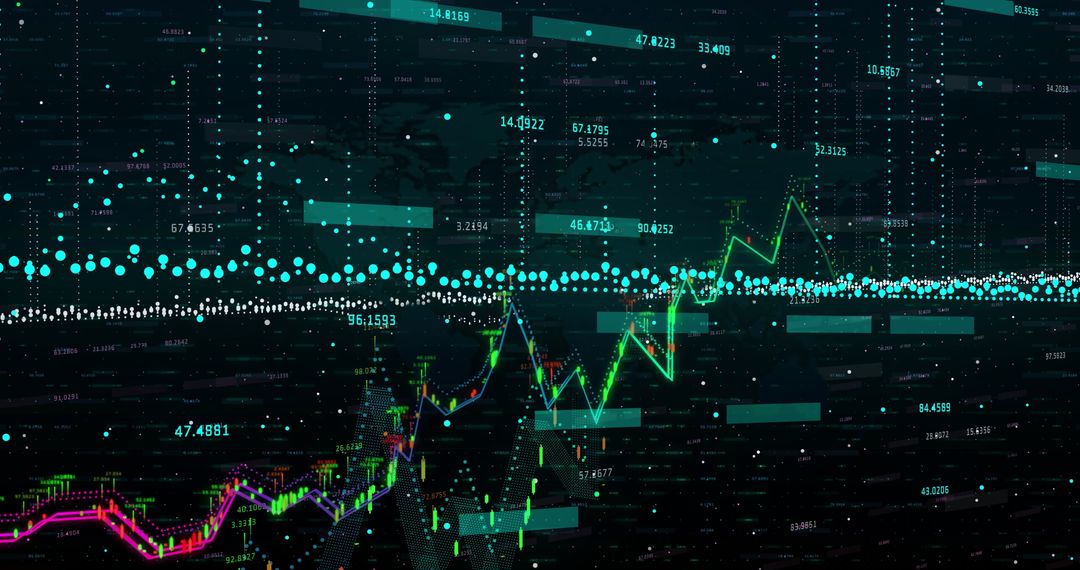
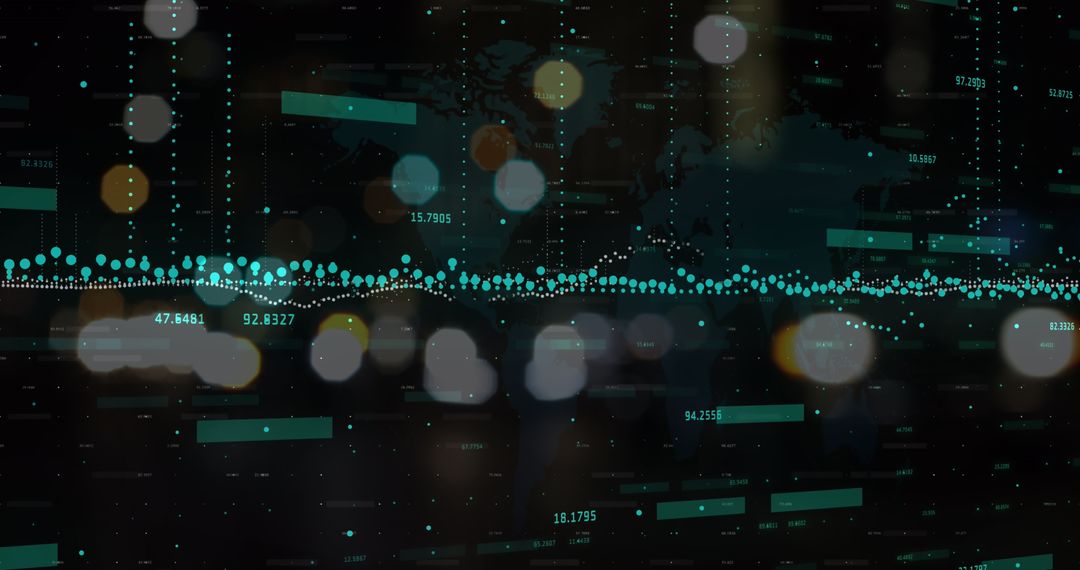
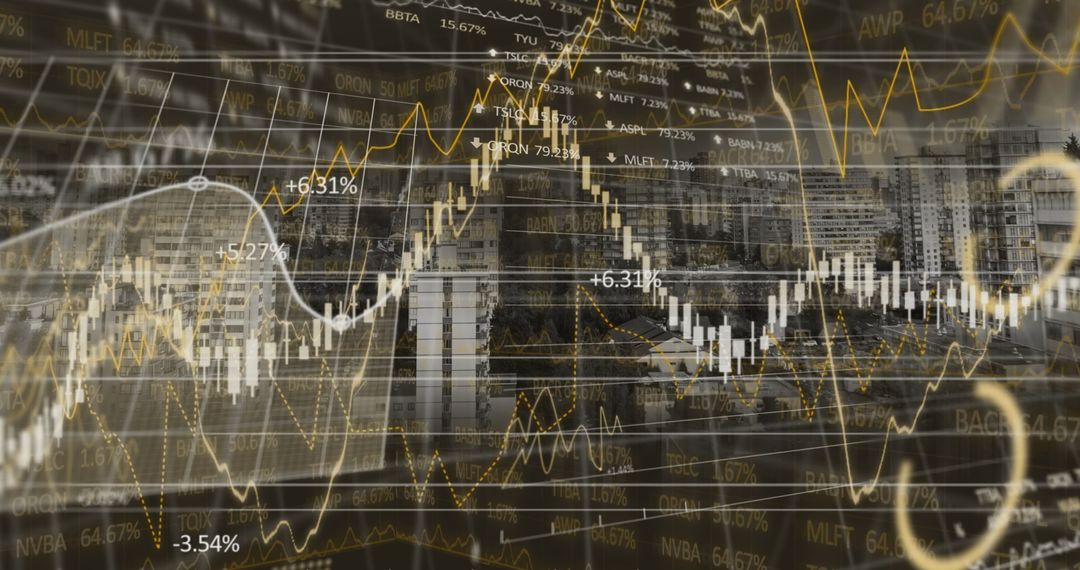
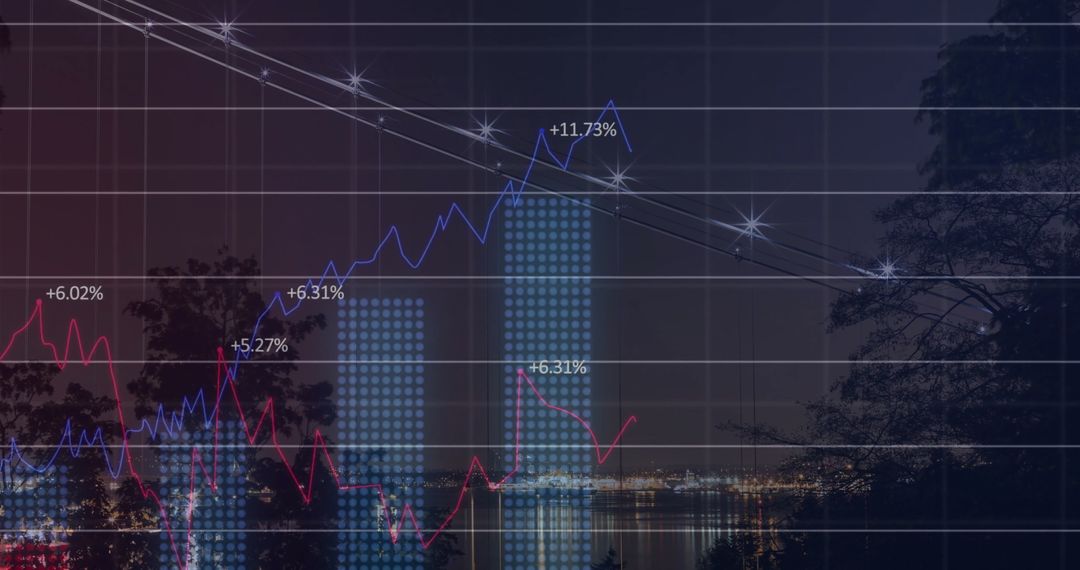
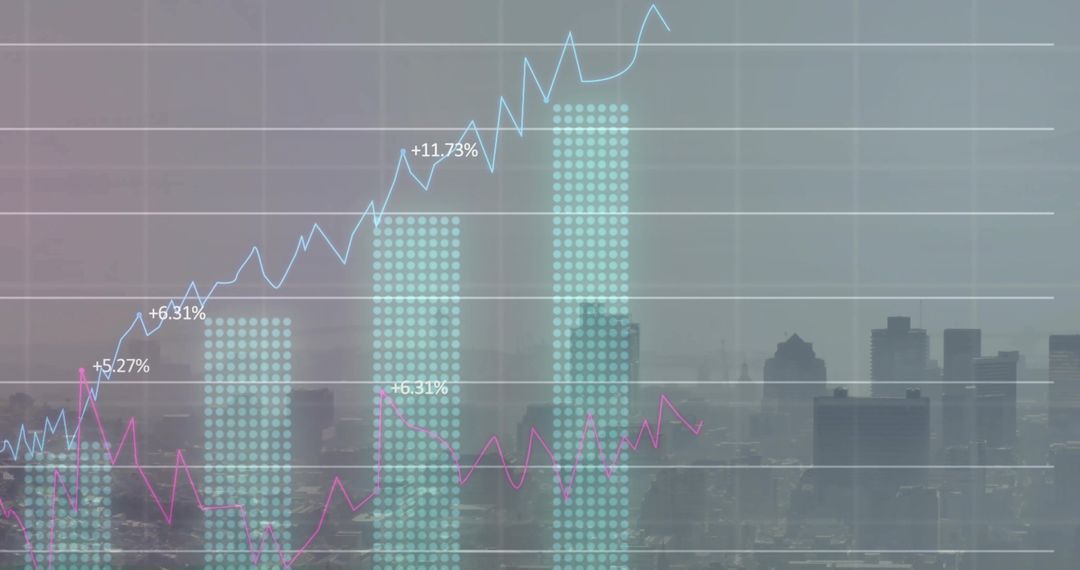
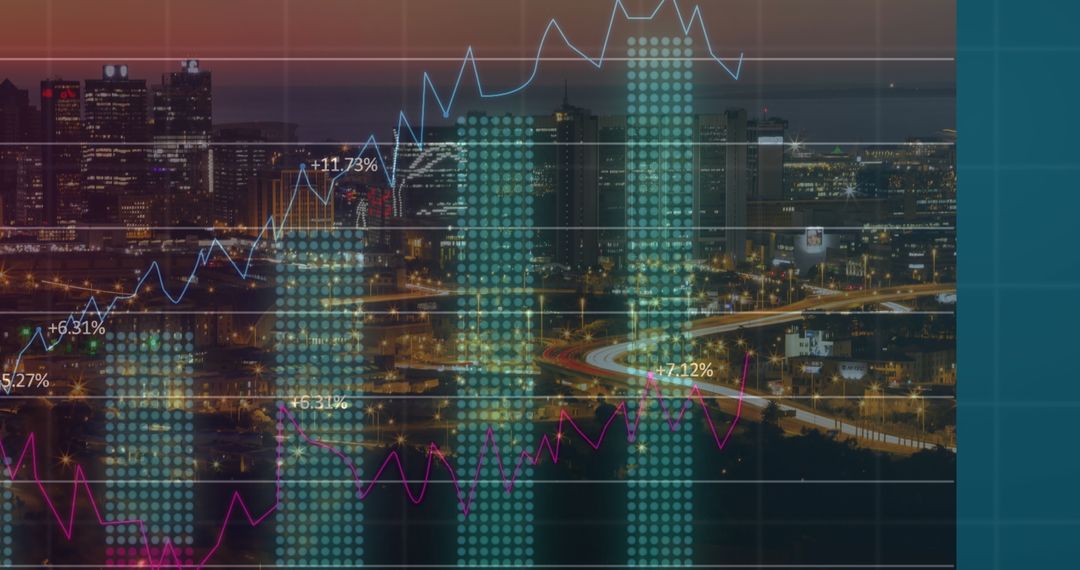
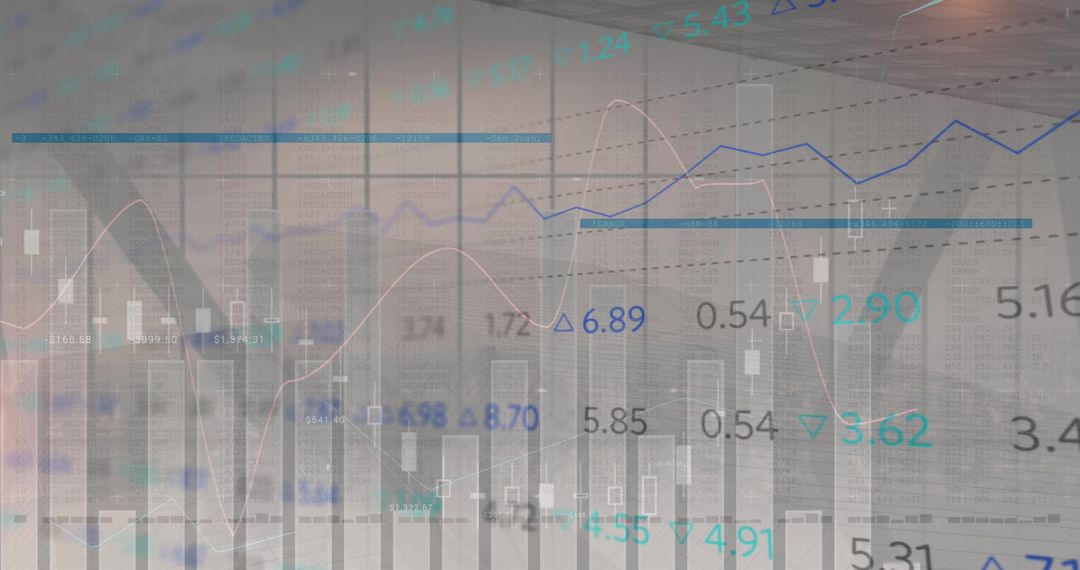
Digital Global Finance Economy Data Visualization Image

Digital Global Finance Economy Data Visualization

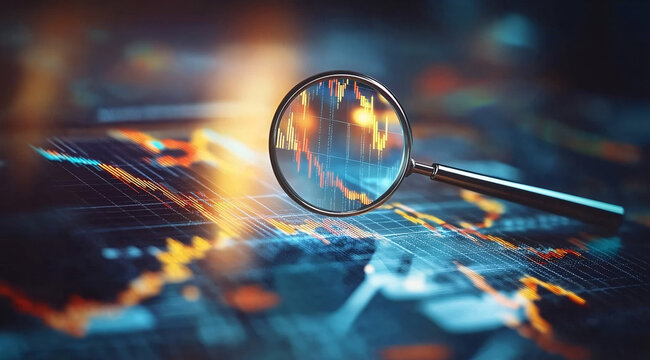
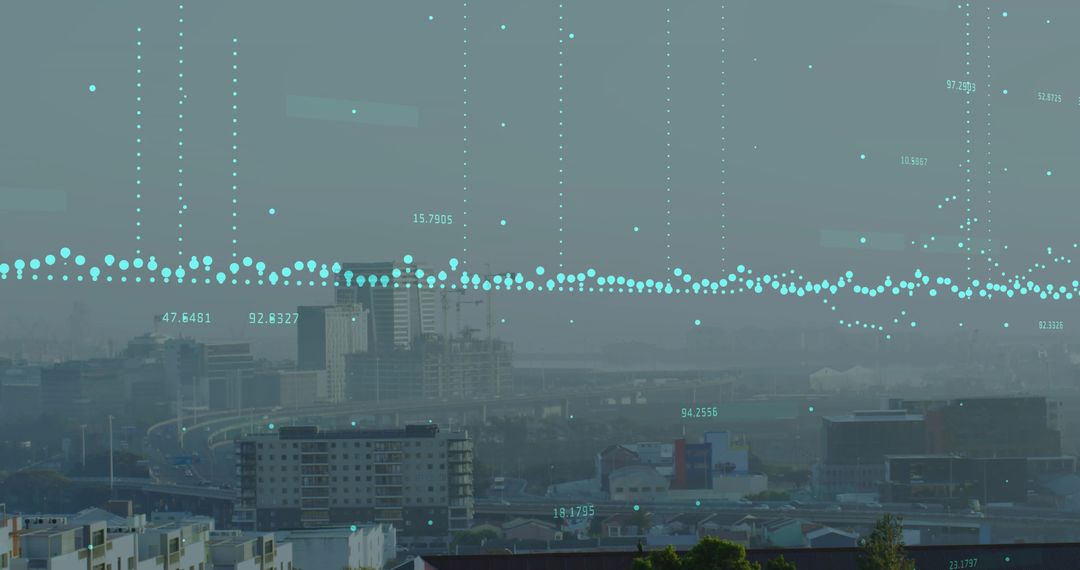
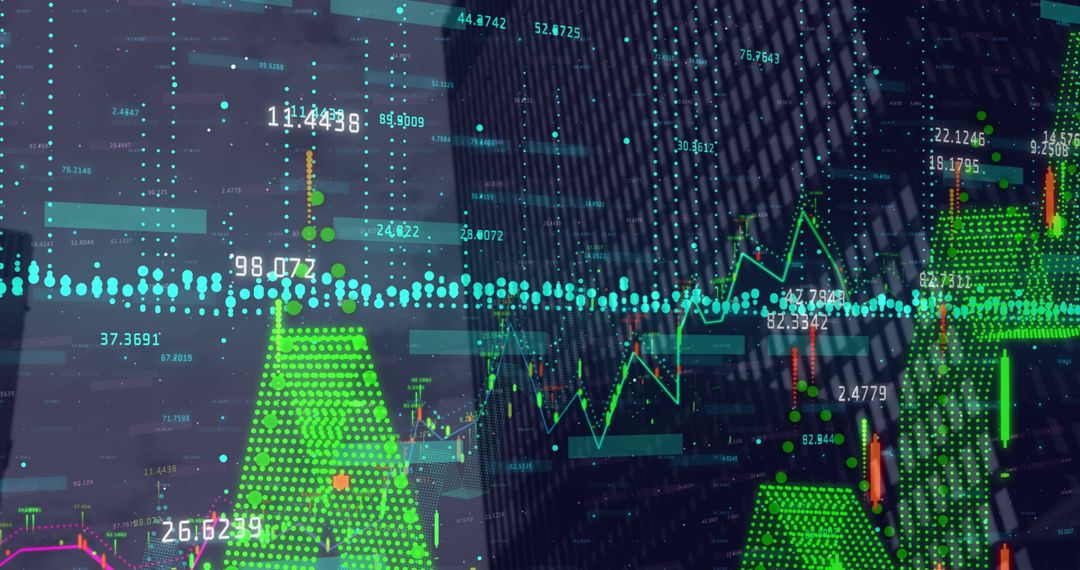
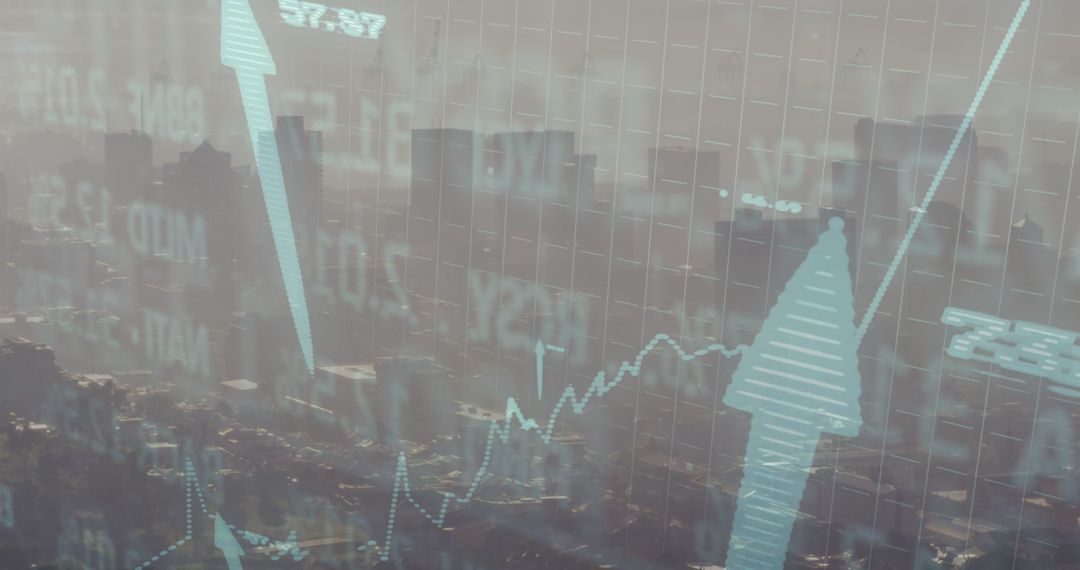
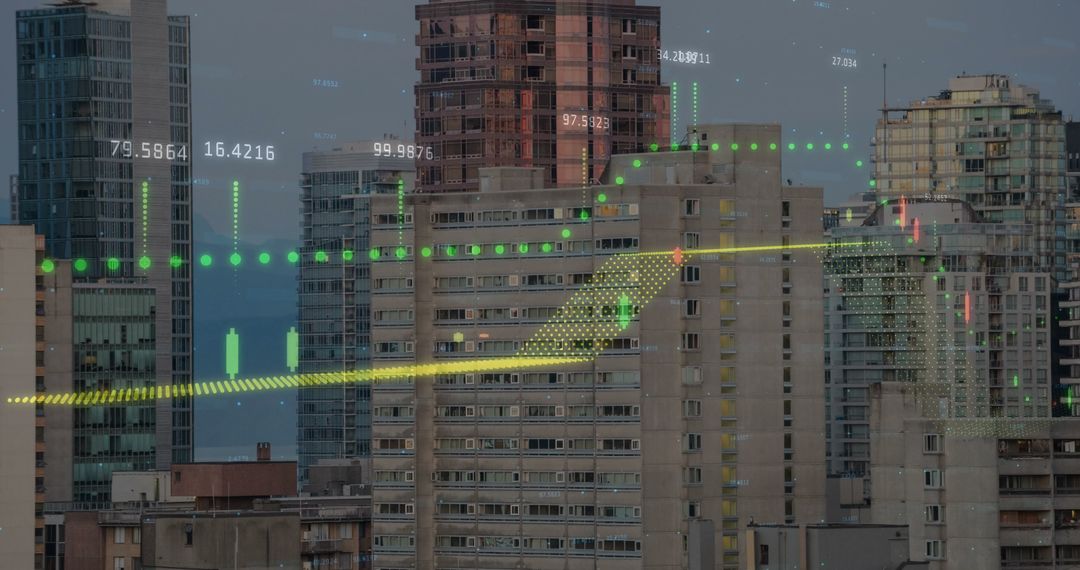
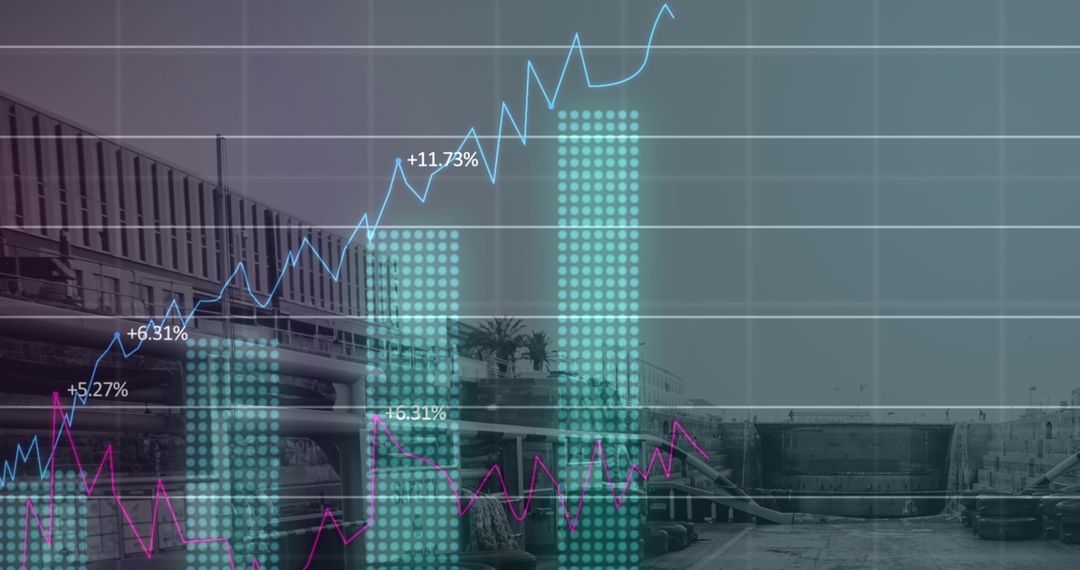
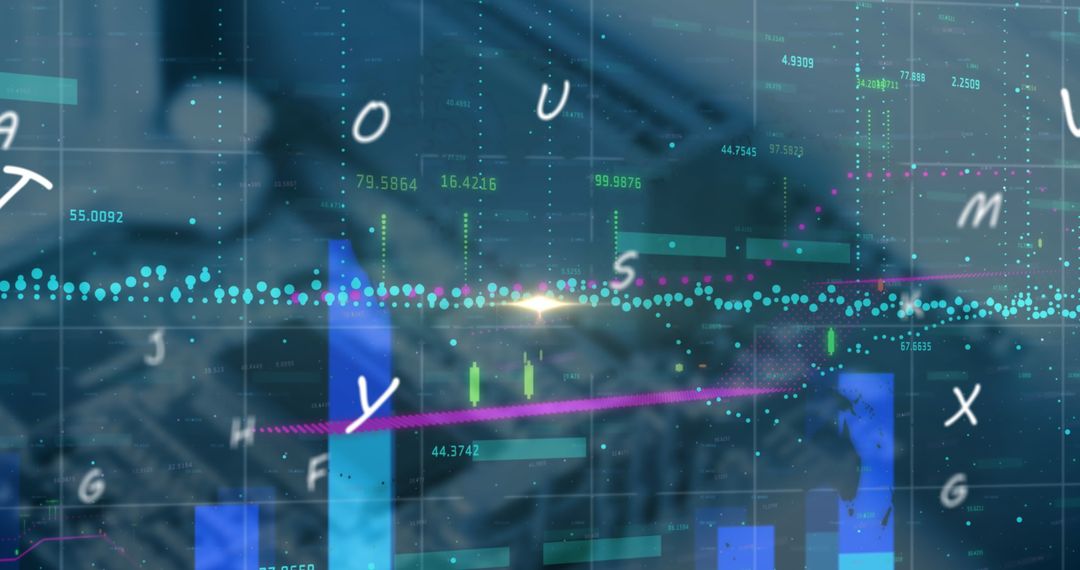
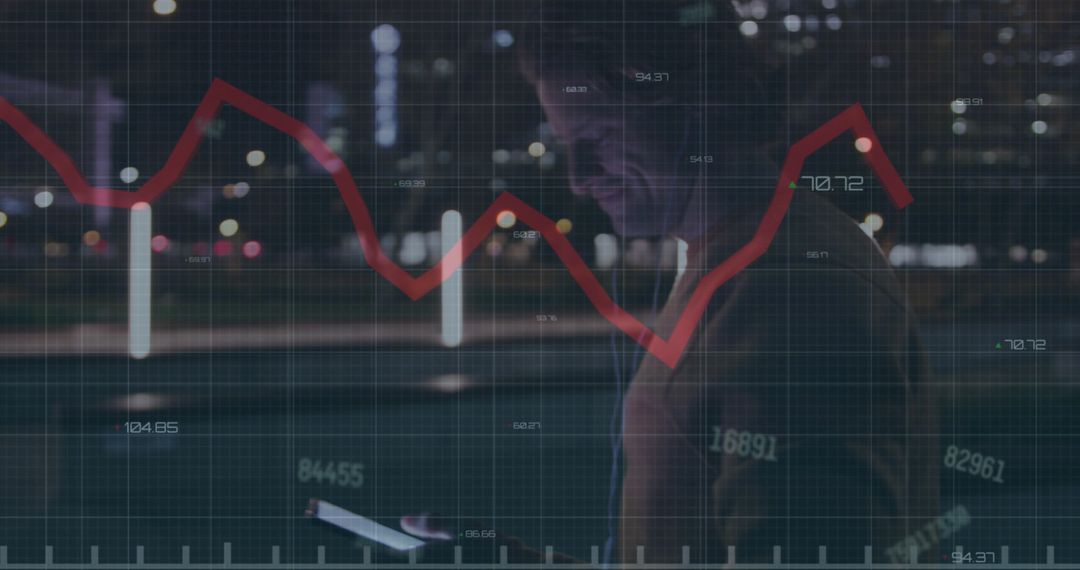
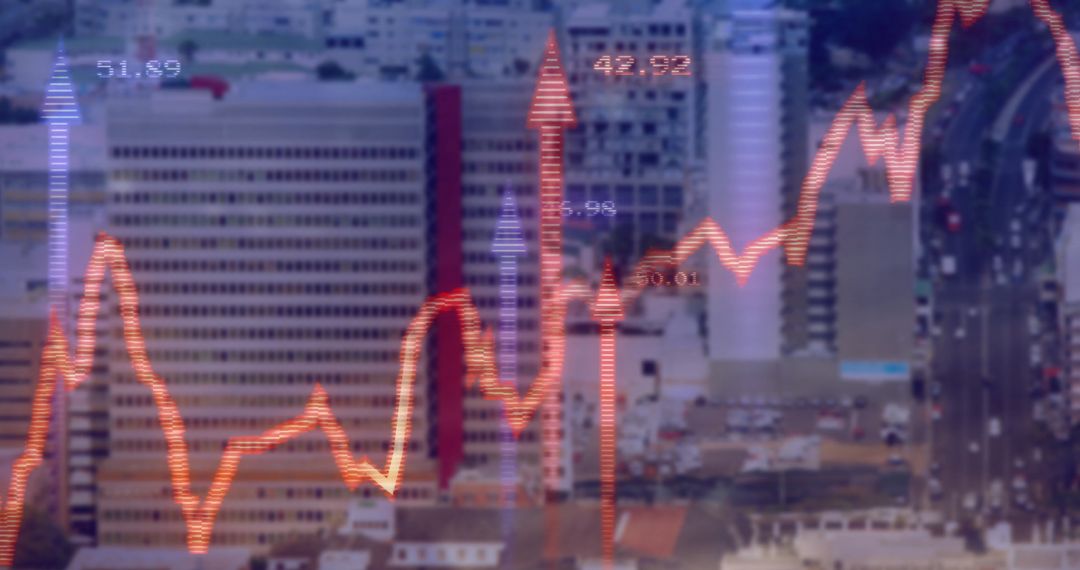
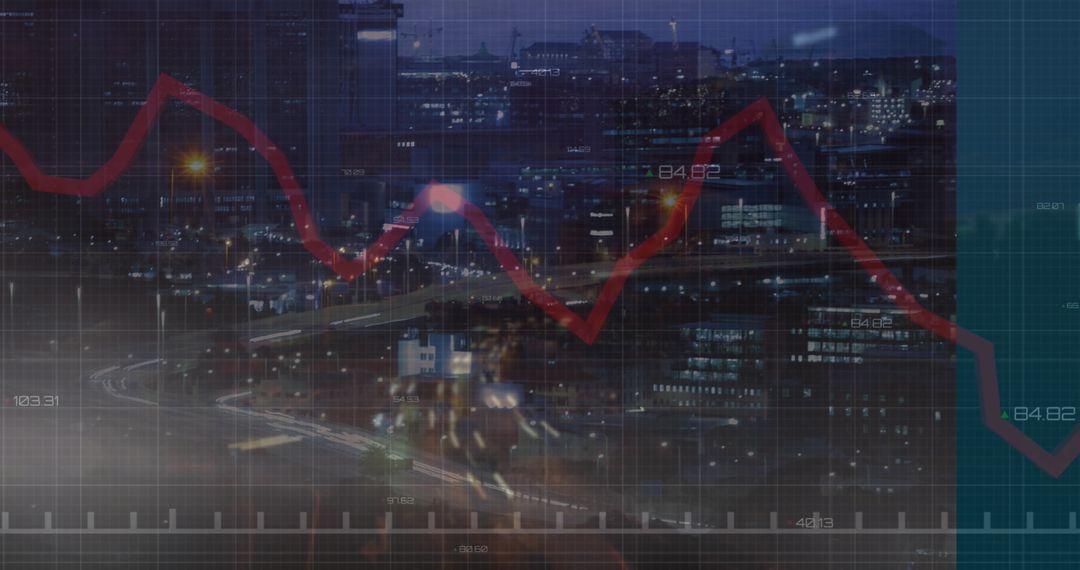
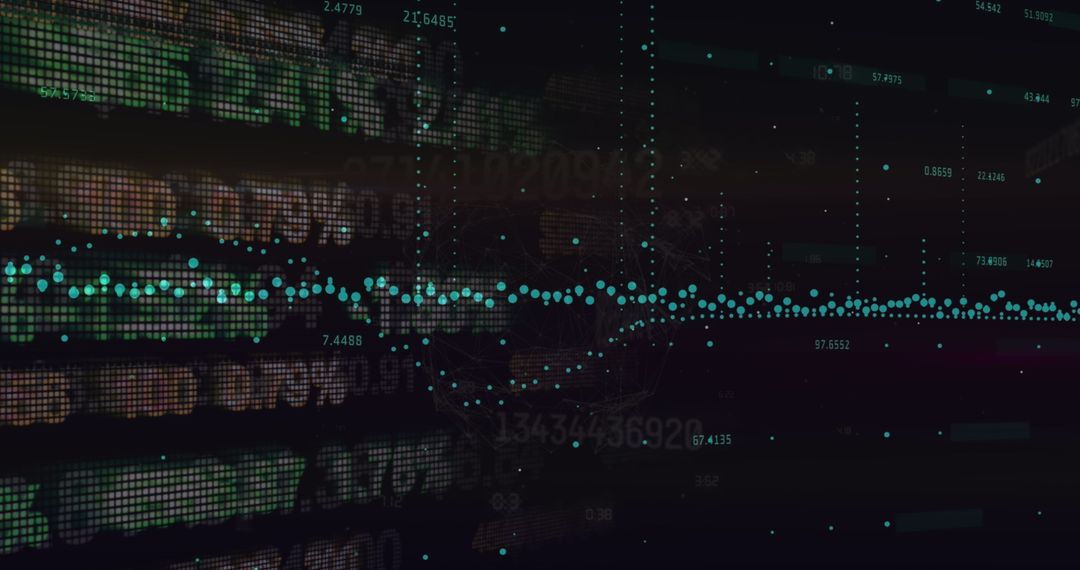
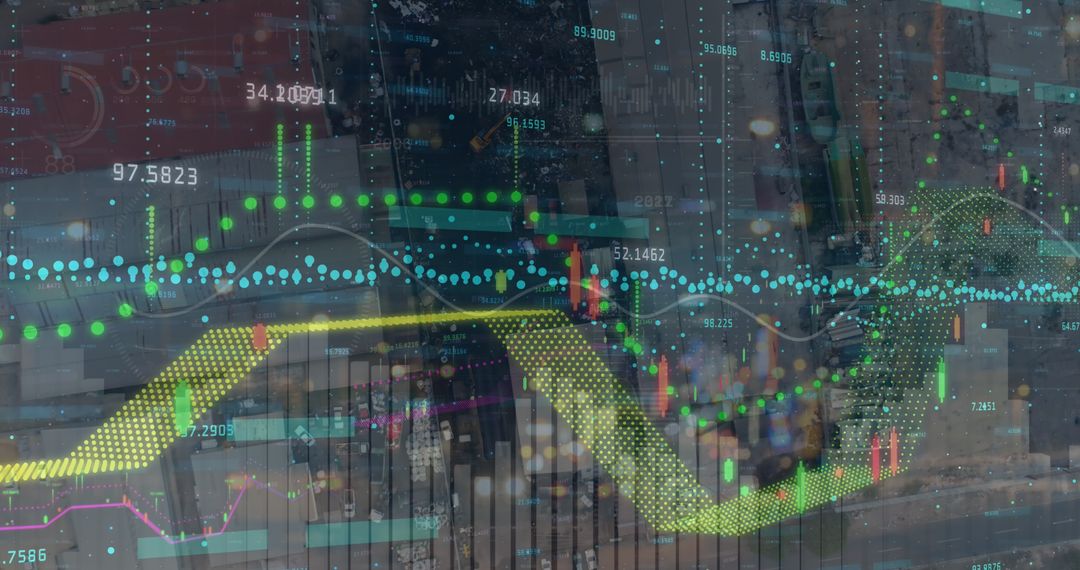
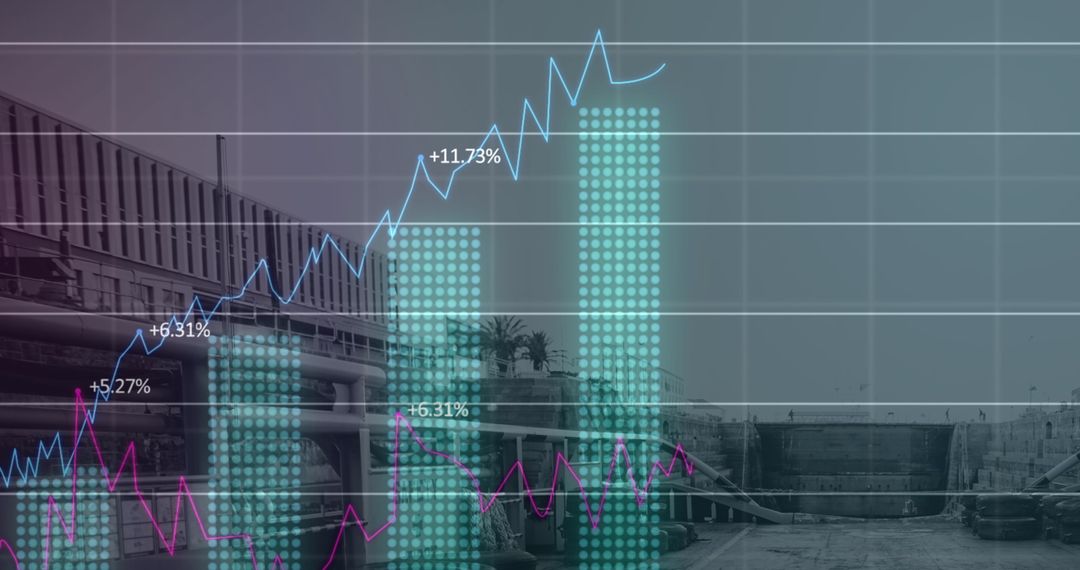
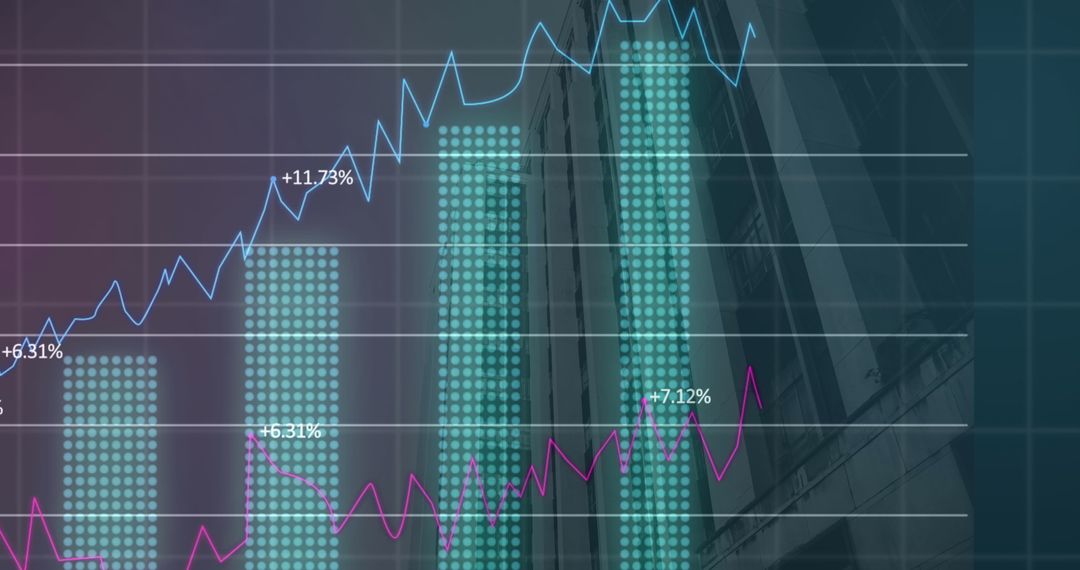
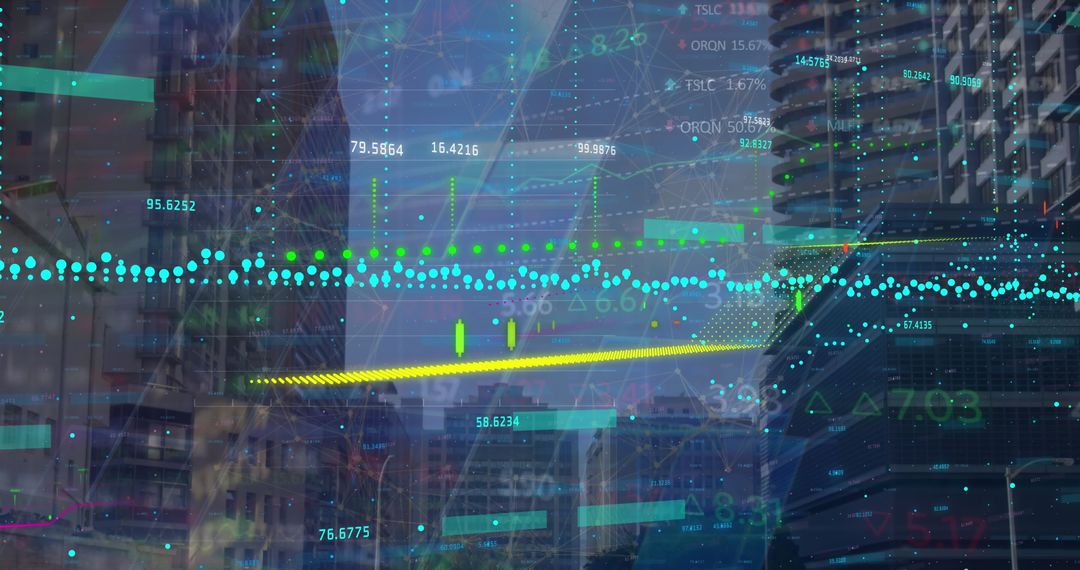
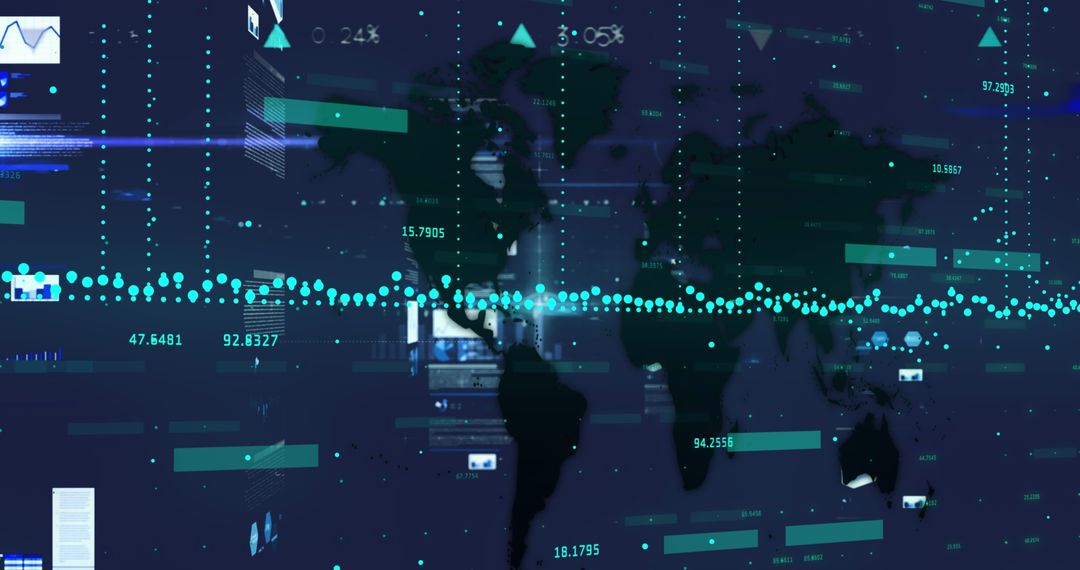
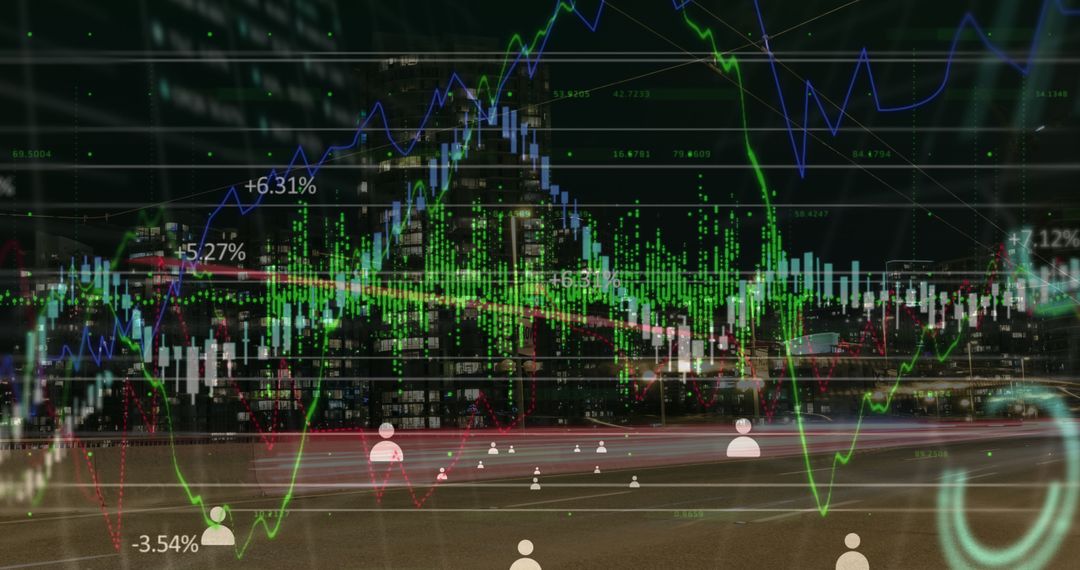
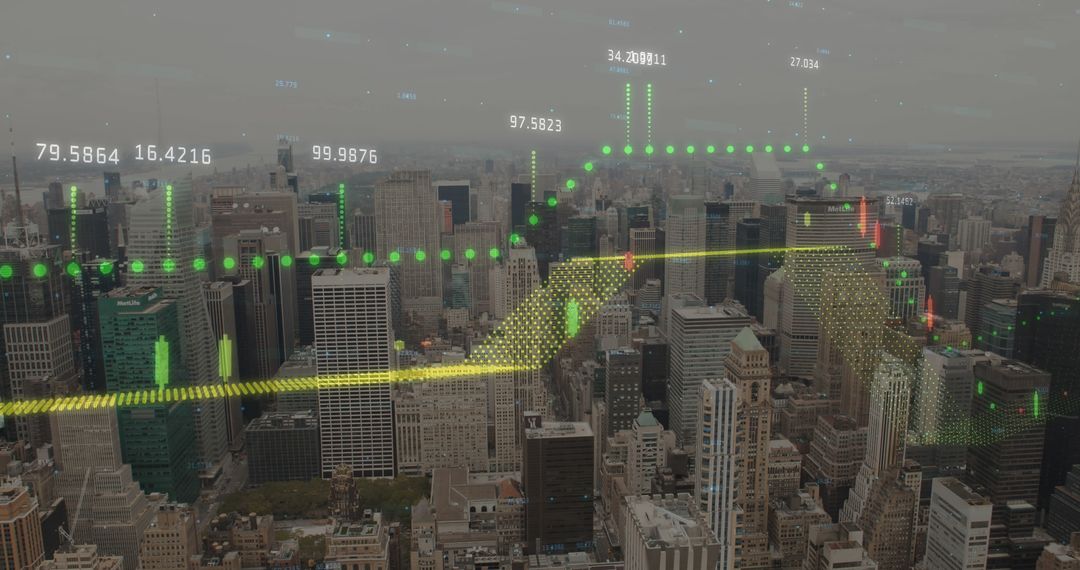
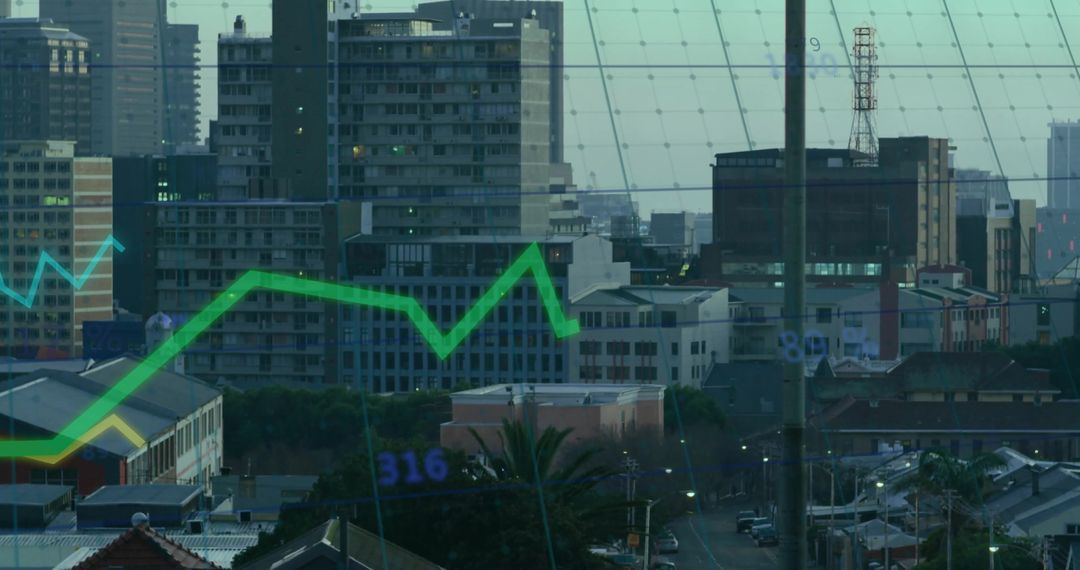
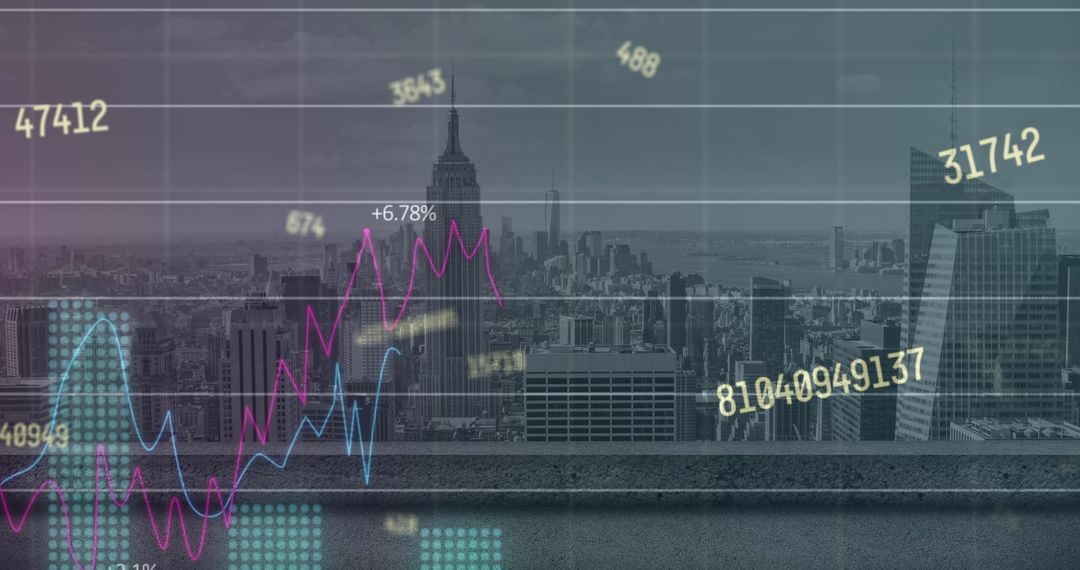
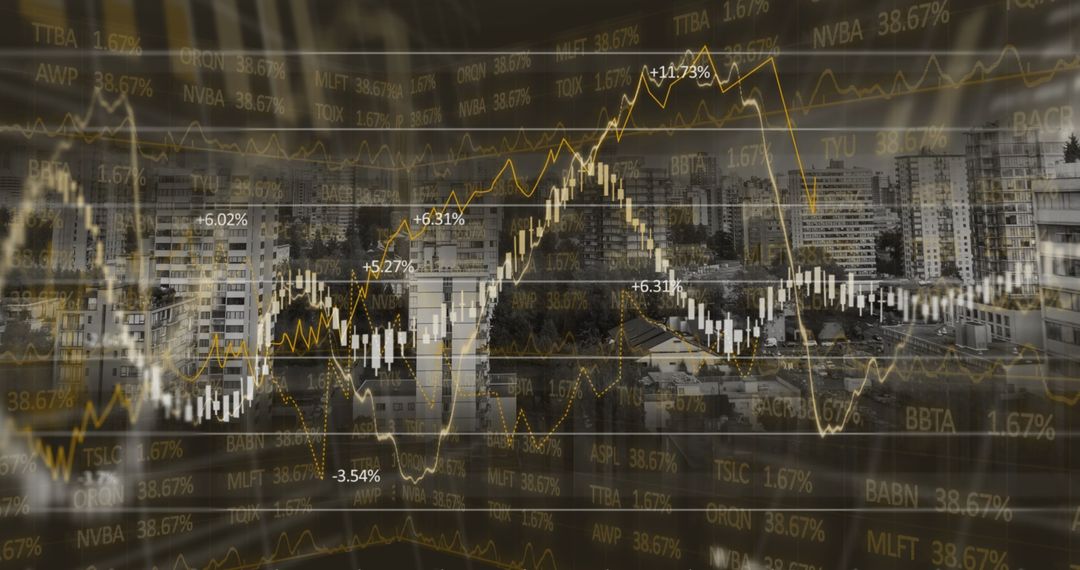
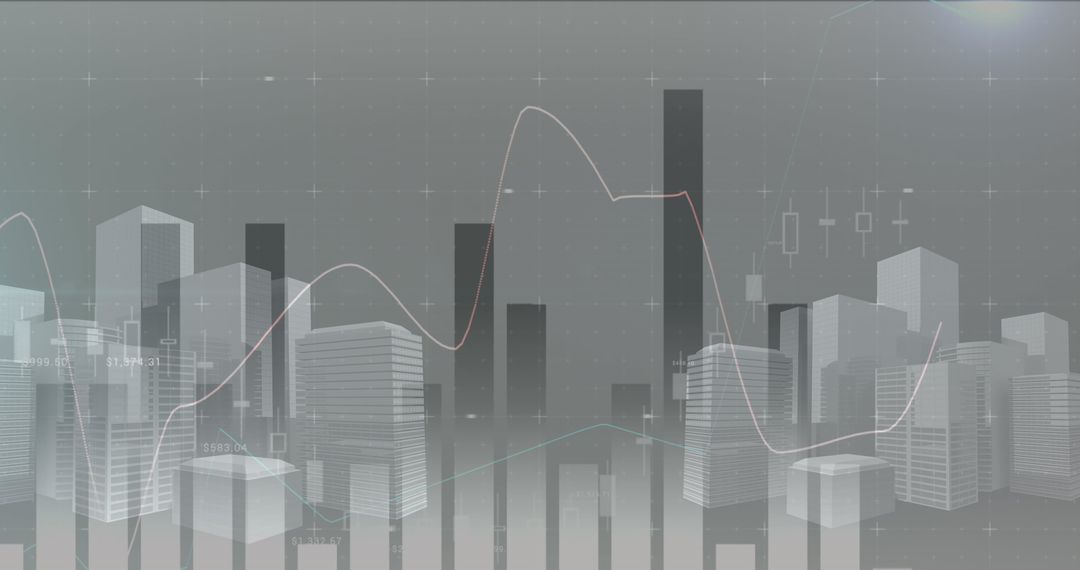
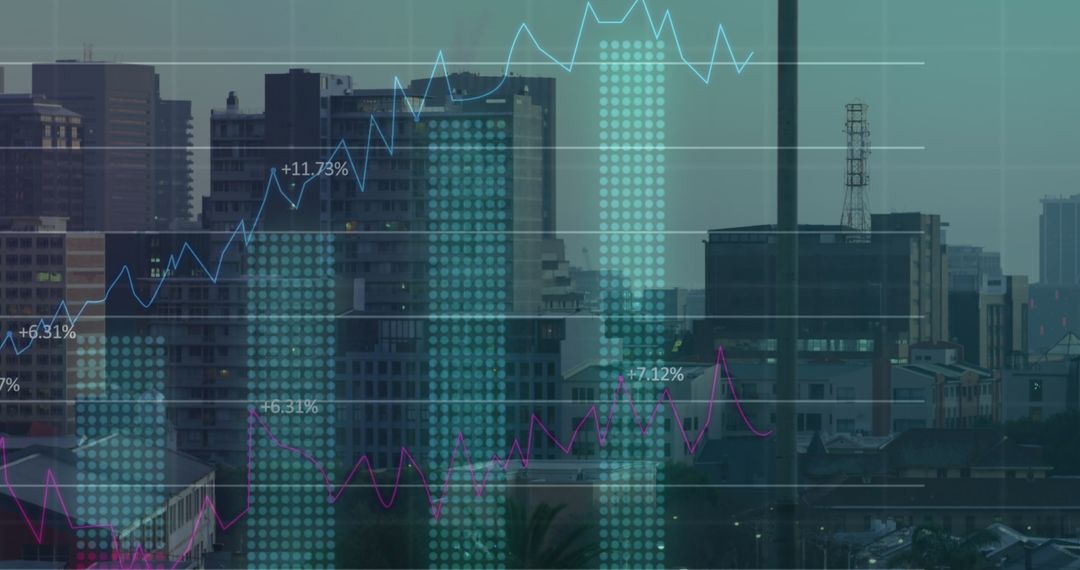
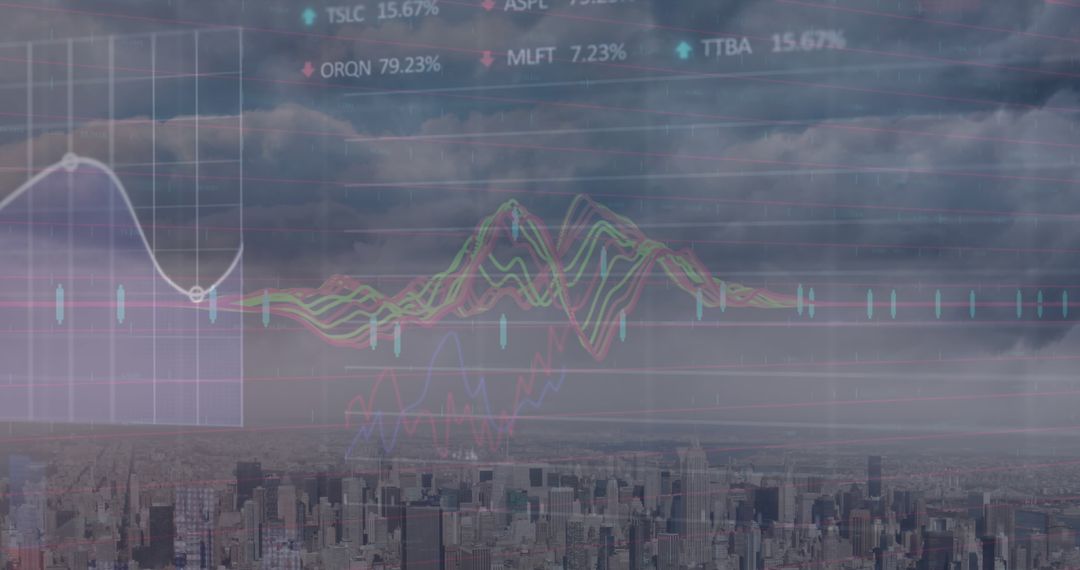
This abstract artwork blends elements of data visualization with a digital backdrop that conceptually represents the flow of finance and economy on a global scale. Useful for presentations, articles, or websites focusing on technological advancements in finance, data analysis, globally connected economies.

Powered by Adobe logo
An analyst uses a computer and dashboard for data business analysis and Data Management System with KPI and metrics connected to the database for technology finance, operations, sales, marketing - Powered by AdobeFinancial market data analysis with glowing 3D bar and line charts on dark background showing economic trends and growth concept visualization. 3D Rendering - Powered by AdobeFinancial analysis concept featuring a magnifying glass over business charts demonstrating growth and increasing profits visualization. - Powered by AdobeA businesswoman analyzes financial documents with charts and graphs at a desk, highlighting data trends with a pen in a bright, professional office setting. - Powered by AdobeUsing tablet pc, Consultant between bookkeepers and accounting lawyer consultation about asset, balance sheet, stock market statistics and yearly tax law, protect business from bribery. - Powered by Adobe

Credit Photo

If you would like to credit the Photo, here are some ways you can do so

Free (free of charge)

Free for personal and commercial use.

Author: People Creations

Similar Free Stock Images

Digital Financial Graphs Overlaid on Urban Skyline
Premium
Abstract glowing big data forex candlestick chart on blurry city backdrop. Trade, technology, investment and analysis concept
Abstract Financial Data and Global Business Interface
Financial Graph Overlay Against Cityscape Illustrating Market Trends
Financial Data Overlay on Night Cityscape Symbolizing Economic Trends
Abstract Financial Chart Overlay City
Premium
Business finance data analytics graph.Financial management technology.Advisor using KPI Dashboard on virtual screen.
Financial Data Processing Over Urban Cityscape
Financial Data Insights Amid Urban Night Traffic
Financial Data and Graphs Overlaying Cityscape
Futuristic Data Over Digital Network Interface
Premium
Investment and finance growth concept. Businessman analyzing money, profit, income, and financial data for economic success, business development, and long-term investment strategy.
Financial Data Graph Over Urban Cityscape
Financial Data Graph Overlapping Construction Infrastructure
Financial Data Processing with Global Business Analytics
Digital Data Visualization Over Computer Server Background
Premium
Data analyzing and stock market visualization with digital charts, financial dashboards, and performance metrics. Ideal for investment analysis, trading strategy, and economic forecasting.
Economic Growth Chart Over Urban Cityscape with Digital Interface
City Skyline Merging with Financial Graphs Demonstrating Market Trends
Financial Data Visualization with Urban Nightscape
Futuristic Digital Interface with Global Finance Graphs
Premium
Transparent or png stock market investment trading graph growth.Trade business analytics graph and financial chart.
Abstract Digital Data and Financial Charts Display
Digital Financial and Statistical Data Display Technology
Businessman Analyzing Stock Market Data on Smartphone at Night
Digital Stock Market Analysis With City Background
Premium
Blue growth graph business chart data diagram on success financial presentation background
Abstract Financial Chart Showing Upward Trend in Global Market
Dynamic Stock Exchange Graph Overlay on City Skyline
Digital Global Data Analysis in Warehouse Environment
Financial Data Visualization Over Night Urban Skyline
Global Finance Technology Vision over Digital Map
Financial Data Analysis Over Urban Skyline Illustrates Global Business
Premium
Business audit stock financial finance management on analysis data strategy with graph accounting marketing or report chart economy investment research profit concept.
Digital Finance Concept with Data Visualization
Futuristic Data Analysis with Interactive Graphs
Financial Data Overlay on Urban Cityscape Depicting Market Growth
Dynamic Financial Data Processed Amid City Lights at Night
Premium
Data Examination: A magnifying glass hovers over financial reports and charts on a sky-blue surface, providing an overview of the business analysis.
Futuristic Interface Display in Modern Data Center
Financial Market Analysis Against Urban Skyline Backdrop
Global Finance Analysis with Runner and World Map Overlay
Business Data Analysis Against City Skyscrapers
Premium
Green arrow pointing upward on financial graph. Business growth chart with rising trend line. Digital stock market data visualization for investment analysis
Digital Technology Integration in Modern Construction Industry
Innovative Construction Strategy with Data Insights
Data Charts Overlaying Spectral Cityscape Highlighting Profit Growth
Global Data Processing with Digital Interface and World Map
Premium
Night cityscape with illuminated skyscrapers and financial stock market chart overlay showing global trade data and growth trends in economy.
Stock Market Graphs Overlay on City Skyline Backdrop
Innovative Financial Analytics in Global Business Environment
Financial Graphs Overlaying Cityscape Illustrate Global Economy
Digital Financial Interface Over Cityscape
Premium
Businesswoman working on laptop with analytics graphs displayed on screen inside warehouse. Concept of logistics, supply chain, inventory management, shipping, ecommerce and distribution.
Global Finance and Data Technology Visualization
Stock Market Analysis with Charts and Graphs Indicating Trends
Financial Data Graphs Overlaying Urban Skyline
Digital Data Analysis Over Cityscape with Scope Overlay
Premium
Sales data analysis dashboard showing performance, trends, and insights. Sales data tracks growth, supports decisions, sales data boosts strategy, and sales data drives performance. Latch
Dynamic Financial Processing and Analytics Concept
Digital Financial Data and Binary Code Overlay
Smart Urban Analytics Over Foggy Cityscape with Energy Icons
Abstract Financial Data Visualization Amidst City Lights
Abstract Financial Data Overlay on City Skyline Imagery
Financial Data Overlaid on Warehouse Representing Trade and Logistics
Premium
Business Financing Accounting Banking Concept, Businesswoman doing finances and calculating financial report with business graph growth cahrt, finance and investment concept
Stock Market Data Overlay on Modern Cityscape
Digital Data Streams Overlay Global Cityscape
Financial Charts Overlaying Urban Cityscape at Dusk
Digital Data Processing Overlay on Metropolitan Skyline
Premium
The magnifying glass highlighting financial data and market trends on paper.
Abstract Data and Technology with Business Facilitator
Global Economic Trends Overlapping Environmental Issues
Abstract Overlay of Statistical Data on Urban Buildings
Digital Interface Overlaying Modern Urban Cityscape
Premium
Glowing upward arrow graph made of digital particles, symbolizing growth and success on a dark background with bokeh lights.
Urban Construction With Digital Financial Overlay
Digital Data with Financial Graphs on Global Grid
Financial Data Overlays on Cityscape Visualizing Economic Trends
Futuristic HUD Interface for Data Analysis and Finance
Premium
An analyst uses a computer and dashboard for data business analysis and Data Management System with KPI and metrics connected to the database for technology finance, operations, sales, marketing
Digital Financial Analysis Over Urban Cityscape
Financial Data Analytics Over NY Cityscape, Digital Trends Display
Smart City and Financial Growth with Digital Graphs
Digital Stock Market Data with Fluctuating Numbers and Graphs
Premium
Man types on laptop with data charts and graphs overlay for business analysis
Financial Data Chart with Rising Trends Overlaid on Cityscape Background
Digital Data Analysis Overlapping Modern Urban Skyline
Data Analytics Overlays on Blurred City Nightscape
Financial Data and Cityscape at Night with Rising Graph
Premium
Inflation and tax concept Rising inflation rates graph. Global economy recession. interest rate, business, finance and investment background. Stack of coins money with financial graph and copy space
Digital Data Waves Overlaying Urban Landscape
Rising Data Trends in Urban Landscape with Translucent Chart Overlay
Financial Data Analysis Digital Interface Over Cityscape
Abstract Cityscape with Financial Data Overlays
Financial Visualization Overlooking Urban Cityscape
Dynamic Financial Data Displayed Over Cityscape Background
Premium
Business audit stock financial finance management on analysis data strategy with graph accounting marketing or report chart economy investment research profit concept
Financial Data Processing with Dynamic City Lights Overlay
Digital Interface of Financial Growth Over Modern Cityscape
Financial Graphs with Cityscape Background Reflecting Market Trends
Financial Data and Graphs Overlaying a Cityscape
Premium
Drive your business growth like a pro with data-driven insights for financial success and prosperity
Stock Market Data Overlay on Urban Cityscape Skyline
Futuristic Digital Financial Analysis with City Background
Financial Data Visualization Over Construction Site
Financial Data Overlay on Urban Construction Background
Premium
Business documents analysis research financial reports charts magnifying glass sticky notes detailed data review
Futuristic Digital Data Processing and Analysis Concept
Digital Data Overlays in Urban Future Cityscape
Economic Growth and Analysis in Urban Areas
Global Financial Data Overlaid on Cityscape Background
Premium
Magnifying glass highlights business growth chart with upward trend. Generative AI analysis financial success stock increase profit investment statistic performance market economy improvement
Digital Data Processing Overlay on Cityscape at Dusk
Financial Data Processing with Digital Graph Overlay
Digital Data Interface with Graphs and Analysis Graphics
Digital Financial Data Visualization Over Dusk Cityscape
Premium
Female analyzing data on computer in modern office with charts and graphs displayed
Financial Charts Overlaid with Data and Trends in Abstract Display
Financial Market Data Visualization with Global Chart Overlay
Futuristic Cityscape with Digital Overlay Indicating Technological Connectivity
Abstract Landscape with Financial Data and Global Connections
Premium
Business audit stock financial finance management on analysis data strategy with graph accounting marketing or report chart economy investment research profit concept
Data Points Overlaying Modern Urban Cityscape at High Angle View