1. Home > 
  2. Stock Photos > 
  3. Digital Graph and Data Analysis with Financial Growth Trends

Digital Graph and Data Analysis with Financial Growth Trends Image

Digital Graph and Data Analysis with Financial Growth Trends

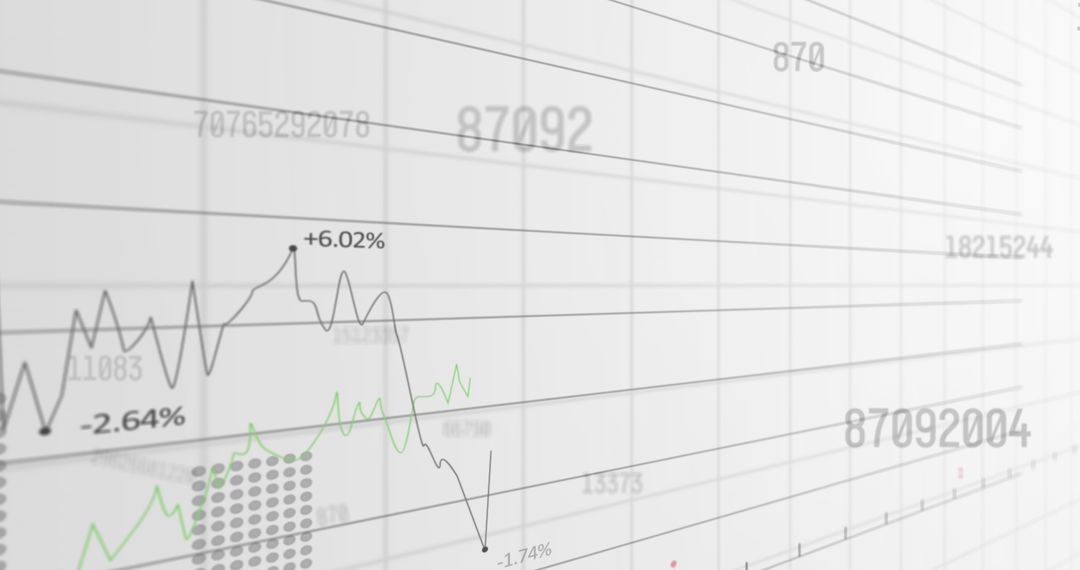
Image visually illustrating analytics and data strategies with fluctuating financial trends against abstract background conveying aspects of the modern economy. Useful for presentations, finance blogs, articles related to economic forecasts, stock market analysis, data technology companies unobtrusively illustrating concepts of interconnected, digitized economies. Appropriate for infographics output or details demanding numeric displays.

Powered by Shutterstock logo - Get 15% off with code: PIKWIZARD15
Banking business, finance and investment concept. Businessman analyzing market data, financial graph report, economic growth, business strategy, planning and solution, risk management - Powered by Shutterstock - Get 15% off with code: PIKWIZARD15Stock market analysis, business, finance and investment. Finance analyst analyzing stock market trading graph, economic growth chart, planning and strategy, business investment with financial report - Powered by Shutterstock - Get 15% off with code: PIKWIZARD15Businessman using mobile smart phone. Business global internet connection application technology and digital marketing, Financial and banking, Digital link tech, big data. - Powered by Shutterstock - Get 15% off with code: PIKWIZARD15Business analysis big data screen and economic growth with financial graph. Concept of virtual dashboard technology digital marketing and global economy network connection. 3D illustration. - Powered by Shutterstock - Get 15% off with code: PIKWIZARD15Business woman sitting front laptop computer with financial graphs and statistics on monitor. Double exposure. Wide - Powered by Shutterstock - Get 15% off with code: PIKWIZARD15

Credit Photo

If you would like to credit the Photo, here are some ways you can do so

Free (free of charge)

Free for personal and commercial use.

Author: People Creations

Similar Free Stock Images

Colorful Stock Market Display with Graphs and Tickers on Blue Background
Premium
Business people analyze financial data chart trading forex, Investing in stock markets, funds and digital assets, Business finance technology and investment concept, Business finance background.
Financial Data Visualization in Modern Digital Display Office
Global Financial Markets and Technology Analysis
Financial Graphs with Cityscape Background Reflecting Market Trends
Financial Data Display in Digital Grid Design
Premium
Economy and growth on global business network, Business strategy and Digital marketing. Data analysis of financial and banking, Technology protection and data connection
Digital Financial Data Chart and Analytics Interface
Dynamic Stock Market Graphics on Modern Digital Interface
Digital Data Visualization with Futuristic Infographics
Stock Market Data Visuals Displaying Financial Analysis Trends
Premium
Businesswomen use a stylus pen connecting artificial intelligence AI circuit board to analyze data automated chart graph. Innovative technology Machine learning on virtual screen for futuristic.
Dynamic Financial Graphs on Digital Screen Displaying Market Trends
Abstract Digital Stock Market Interface with Graphs and Data
Futuristic Data Chart with Digital Interface Elements
Soundwave Visualization and Data Analysis on Digital Grid
Premium
Businessman using digital tablet on global network connection,  data exchange, business development, metaverse. Internet technology, digital marketing. Financial, banking, investment, global business
Global Financial Data Analysis on Grid Background
Digital Financial Graphs and Business Analytics on Blue Backdrop
Financial Data Analytics Over Digital Grid Screen
Data Visualization with Diagrams on Green Gradient
Premium
Business analysis big data screen and economic growth with financial graph. Concept of virtual dashboard technology digital marketing and global economy network connection. 3D illustration.
Futuristic Stock Market Graphs on Digital Display
Financial Data Charts with Viewing Grid in Dark Perspective
Dynamic Financial Graph with Data Analysis Conceptual Background
Financial Data Processing on Digital Graph Displayed on Screen
Premium
Global business, digital marketing. Businessman using digital tablet with AI technology and global internet network connection, Business strategy analysis for digital marketing, business intelligence
Dynamic Financial Graphs and Dashboard Analytics
Financial Analytics Dashboard with Growth Trends and Indicators
Modern Multi-Colored Financial Graphs on Digital Dashboard
Dynamic 3D Graph Analytics with Red and Blue Bars
Digital Financial Data Stream with Numeric Overlay
Digital Financial Data and Dynamic Stock Market Graphs
Premium
Digital business marketing data management on virtual screen, Businessman use laptop work marketing analysis chart strategic planning analytics dashboard with management data work in modern office
Digital Data Processing Graph Interface with Progress Bar
Digital Financial Data Overlaid on Urban Cityscape at Dusk
Abstract Financial Graph Display on Dark Background
Digital Financial Data Interface on Green Background
Premium
Management data System KPI connected in database for follow earnings,operations and sales data.Businessman using KPI dashboard.Financial business data analytics graph dashboard.
Rising Graphs and Interactive Financial Data Analytics Background
Data Analytics and Stock Market Graphs
Global Financial Trends and Digital Data Visualization Concepts
Digital Financial Graph Illustrating Stock Market Trends
Premium
woman Hand holding virtual Global Internet connection metaverse. Business global internet connection application technology and digital marketing, Financial and banking, Digital link tech, big data.
Dynamic Financial Graphs Illustrating Business Growth
Dynamic Stock Market Analysis on Digital Screen
Digital Soundwaves with Data Graphs and Coding Elements
Dynamic Stock Market Graph with Percentage Indicators
Premium
Stock market analysis, business, finance and investment. Finance analyst analyzing stock market trading graph, economic growth chart, planning and strategy, business investment with financial report.
Digital Data Analytics Growth Trend with Graphs
Financial Stock Market Trends Over Digital Grid Background
Dynamic Financial Data Chart on Green Gradient Background
Dynamic Financial Graph Displaying Market Trends
Premium
Businesswoman holding paper and drawing stock charts with digital business interface. Business and trade concept. Close up
Abstract Digital Financial Data Graph Chart
Data Analytics with Stock Market Chart Display
Dynamic Financial Data Analytics with Stock Market Trends
Financial Analysis with Percentage Shifts on Digital Trading Screen
Premium
Hand Business people touching artificial intelligence AI circuit board to analyze data automated chart graph. Innovative technology Machine learning on virtual screen for futuristic.
Digital Candlestick Chart with Percentages and Analytics Lines
Modern Digital Financial Dashboard with Line and Bar Graphs
Holographic financial analytics dashboard displaying neon code with rising line charts
Financial Data Graphs Over Cityscape Indicating Global Business Concept
Financial Data Over Grid Indicating Market Trends and Analytics
Global Financial Data and Graphs Over Digital Globe Interface
Premium
Businessman using futuristic user interface with virtual data analytics. Innovative dashboard with financial charts, graphs, and global network information for business intelligence.
Dynamic Financial Charts with Blue Digital Interface
Abstract Graph Display with Dynamic Business Growth Indicators
Trending Financial Graphs with Red and Blue Analytics Lines
Dynamic Financial Data Charts on Dark Digital Background
Premium
Business Intelligence, businessman using laptop computer, global network connection, data exchange, digital technology, data science and digital marketing, global business, plan and strategy concept
Digital Financial Data Graph with Winter Snowflake Theme
Statistical Data and Trends Over Digital Grid Overlay
Digital Interface with Data Analytics and Processing Visuals
Analyzing Business Growth with Architectural Backdrop
Premium
Data science. Man programmer using digital tablet computer analyzing and develop software on futuristic virtual interface screen. Algorithm, big data analysis and management, data visualization
Dynamic Financial Graphs with Holographic Elements on Orange Background
Global Data and Financial Trends with Digital Interface
Stock Market Graph with Social Media Notifications Overlay
Dynamic Financial Data with Global Connections and Insights
Premium
businessman holding light blub with virtual Global Internet connection. global internet connection application technology and digital marketing, Financial and banking, Digital link tech, big data.
Abstract Financial Chart with Rising and Falling Indicators
Global Currency Symbols and Financial Network Graph
Digital Stock Market Data and Financial Charts Interface
Digital Visualization of Global Networking with Statistical Graphs
Premium
Global Business and Economic Growth, Financial and Banking Data Analysis, Profitability Goals and Strategies, Stock Market Analysis, Investment Decision Making, AI Technology for Business.
Financial Data Charts with Network Connections Digital Interface
Financial Graph and Data on Digital Interface
Analytics Dashboard with Dynamic Financial Data Visualization
Digital Financial Analytics Dashboard Displaying Diverse Data Visualizations
Premium
Double exposure.Two stock traiders making analysis of digital market and investment in block chain crypto currency. Stock trade concept
Digital Dashboard Displaying Financial Chart and Analytics Interface
Neon Finance Dashboard Featuring Time-Series Lines, Dotted Bars and Live Market Tickers
Financial Data Visualization Overlay with City Skyline Background
Ukraine Crisis Financial Graphs Overlay
Financial Chart and Rotating Globe on Digital Grid Background
Financial Data Analytics on Digital Interface Displaying Graphs
Premium
Businessman or Investor data analysis for planning in strategy of stock market fund and Business investment management concept.
Statistical Data on Orange Gradient Background
Financial Data Visualization on Digital Grid
Financial Data Analysis Graph with Growing Trends
Digital Financial Data Display Tracking Market Trends
Premium
Business analysis, strategy and planning concept. Businessman, finance analyst working on digital tablet, business data and economic, economic growth, financial graph chart, stock market report
Colorful Data Analytics Bar Graphs on Digital Screen
Data Analytics with Dynamic Global Market Trends on Screen
Abstract Graphic Business Data Visualization
Finance and Technology Theme with Stock Market Data Overlay
Premium
Intelligence (BI) and business analytics (BA) with key performance indicators (KPI) dashboard concept.StartUp Programming Team. Website designer working digital tablet dock keyboard.
Digital Financial Data Analysis and Stock Market Charting
Abstract Financial Data Visualization with Graphs and Grid Background
Data Processing Overlaid on Graphs and Code in Digital Interface
Financial Data Projection in Modern Office Space
Premium
Business analysis. Businessman working on laptop computer analyzing finance sales data and economic growth graph chart and financial report, business and technology concept.
Dynamic Financial Data Growth Chart Display
Digital Financial Data Analysis on Abstract Blue Background
Financial Data Graphic with Rising Trends on Digital Grid
FinTech Global Data Chart with Statistical Analysis
Premium
Businessman working with modern computer calculator virtual dashboard analyzing finance sales data and economic growth graph chart and  account report technology.
Dynamic Graphs and Charts on Technology Background
Financial Analytics Dashboard with Trend Lines and Data Visualization
Dynamic Digital Display of Financial Data
Dynamic Financial Data Visualization with Charts and Arrows
Premium
Businessman using digital tablet on global network connection, data exchange, business development, metaverse. Internet technology, digital marketing. Financial, banking, investment, global business
Subscriber Analytics Dashboard with Candlestick Charts and Line Graphs Showing 477,785 Subscribers