- Home >
- Stock Photos >
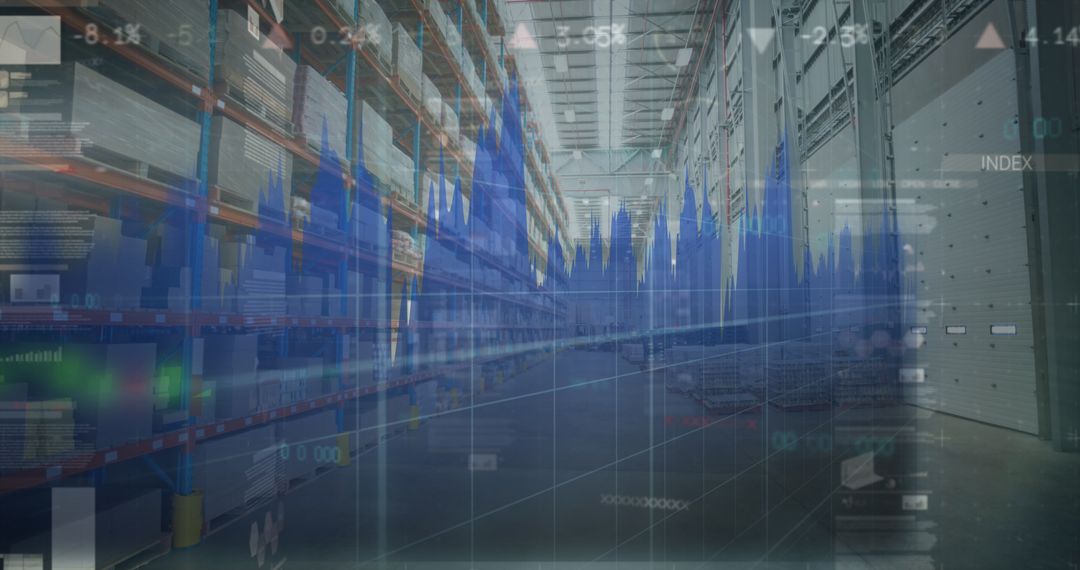
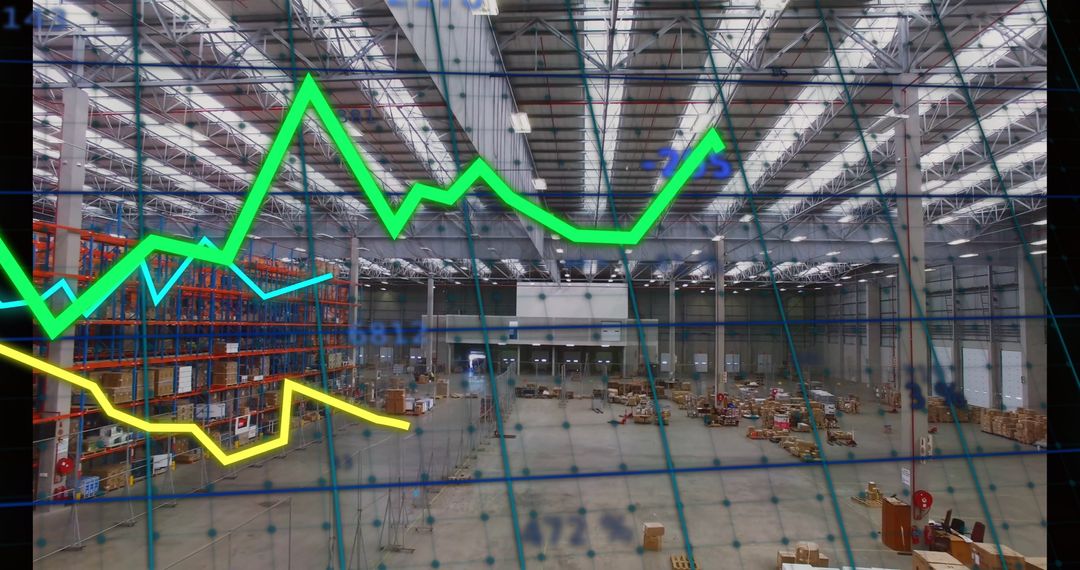
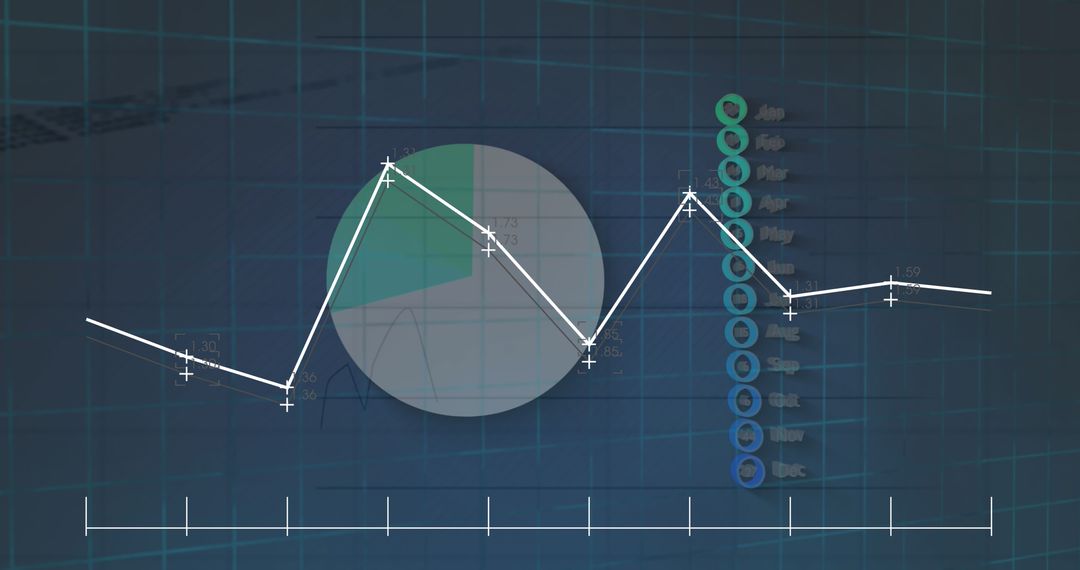
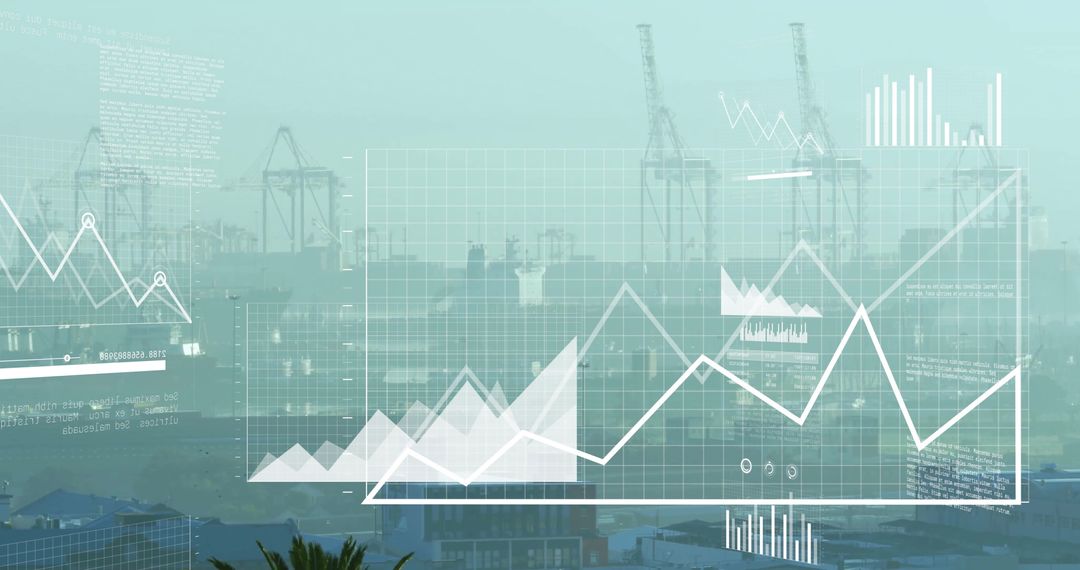
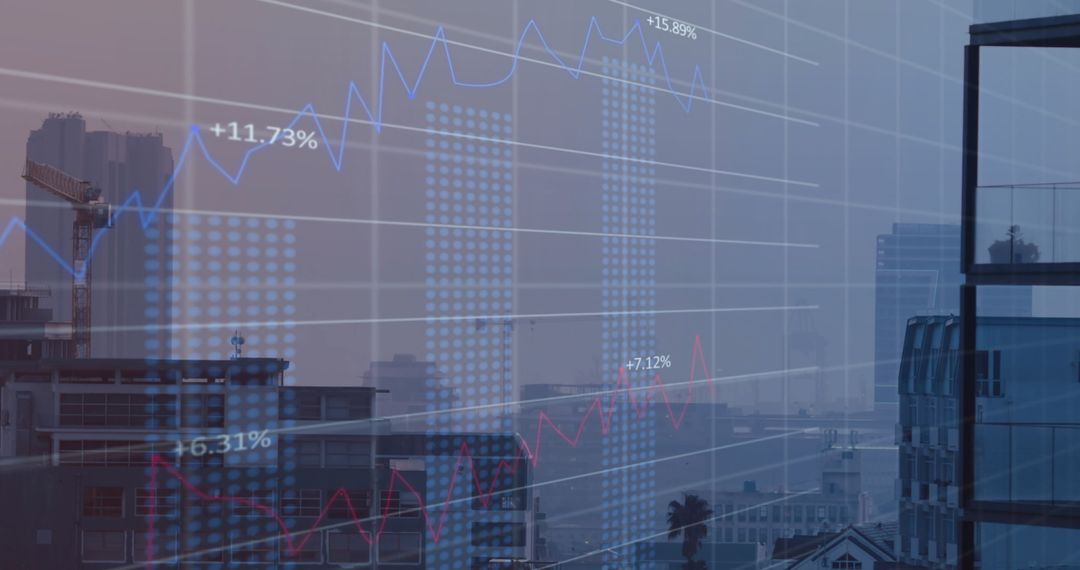
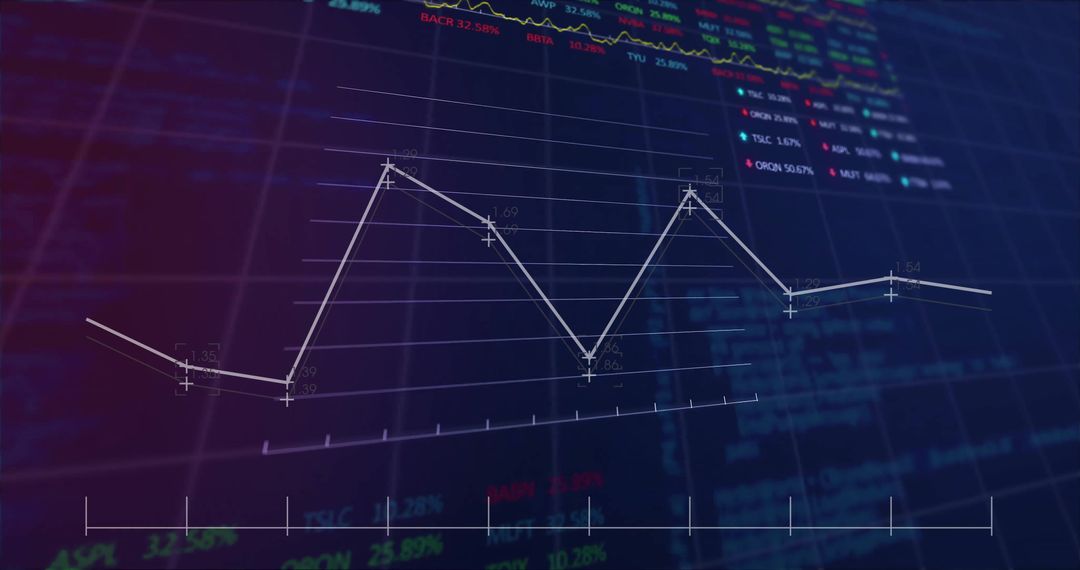
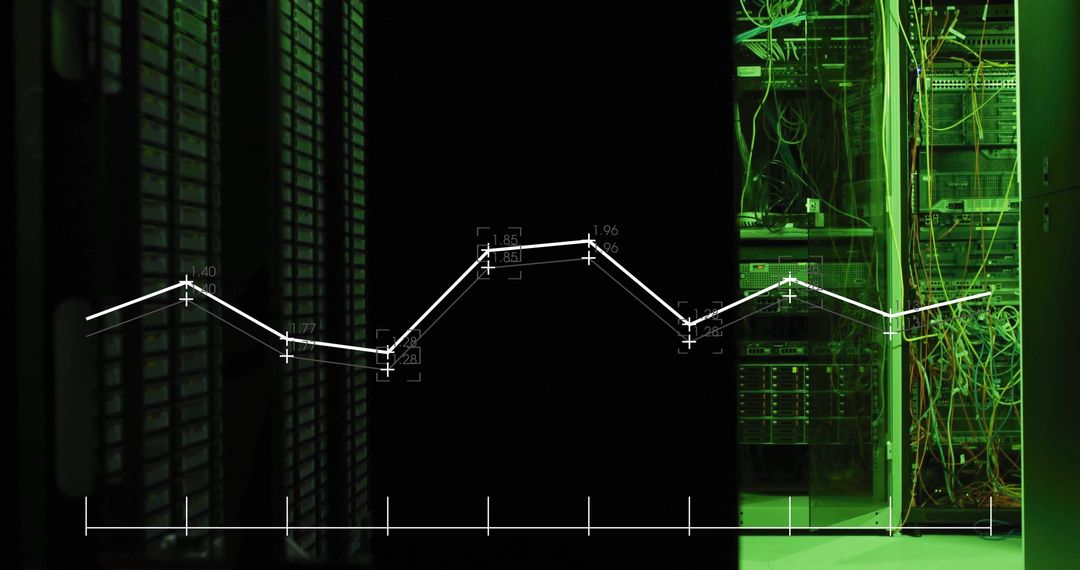
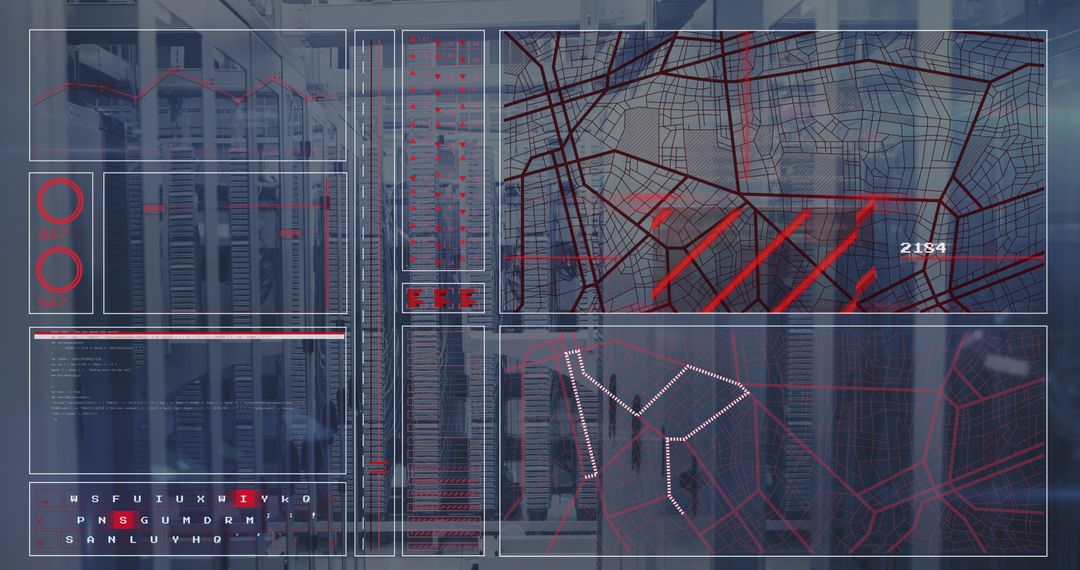
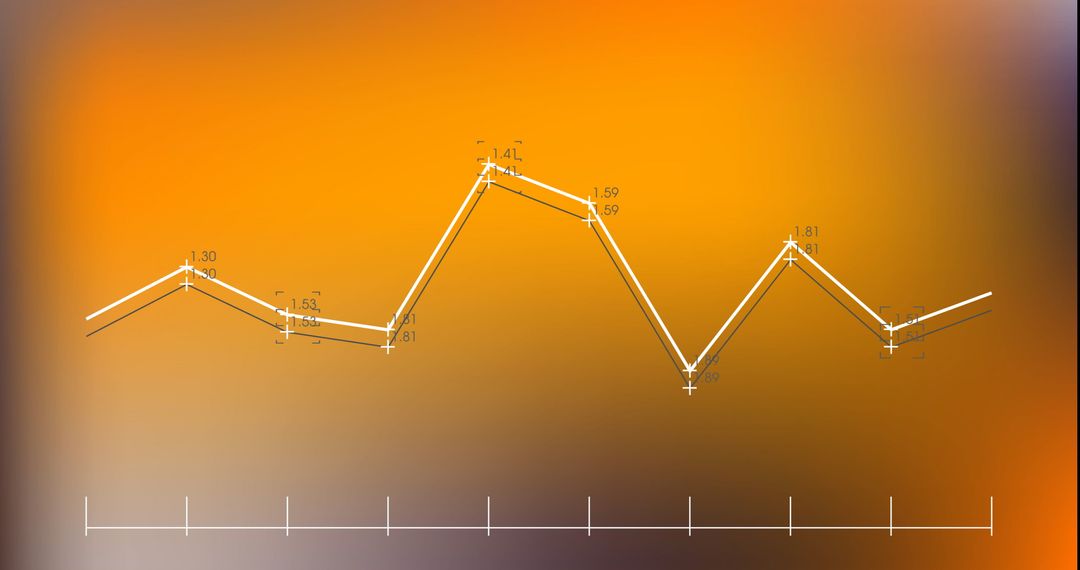
- Digital Graph Overlay of Fluctuating Warehouse Inventory Levels
Digital Graph Overlay of Fluctuating Warehouse Inventory Levels Image
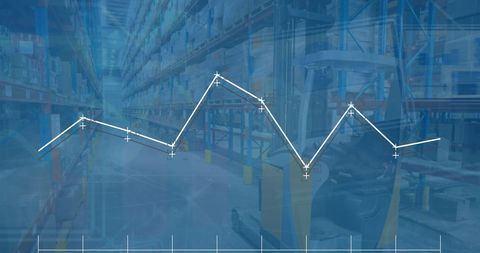
Graph dynamically represents changing stock levels in large warehouse, ideal for presentations on inventory management and supply chain optimization. Suitable for illustrating data analysis, predictions, and automated logistics solutions. Perfect for use in business reports, educational materials, and logistical training resources.

2
downloads
downloads
Tags:
More
Credit Photo
If you would like to credit the Photo, here are some ways you can do so
Text Link
photo Link
<span class="text-link">
<span>
<a target="_blank" href=https://pikwizard.com/photo/digital-graph-overlay-of-fluctuating-warehouse-inventory-levels/6853a527728c2214c454702e33f6f876/>PikWizard</a>
</span>
</span>
<span class="image-link">
<span
style="margin: 0 0 20px 0; display: inline-block; vertical-align: middle; width: 100%;"
>
<a
target="_blank"
href="https://pikwizard.com/photo/digital-graph-overlay-of-fluctuating-warehouse-inventory-levels/6853a527728c2214c454702e33f6f876/"
style="text-decoration: none; font-size: 10px; margin: 0;"
>
<img src="https://pikwizard.com/pw/medium/6853a527728c2214c454702e33f6f876.jpg" style="margin: 0; width: 100%;" alt="" />
<p style="font-size: 12px; margin: 0;">PikWizard</p>
</a>
</span>
</span>
Free (free of charge)
Free for personal and commercial use.
Author: Awesome Content
Similar Free Stock Images