- Home >
- Stock Photos >
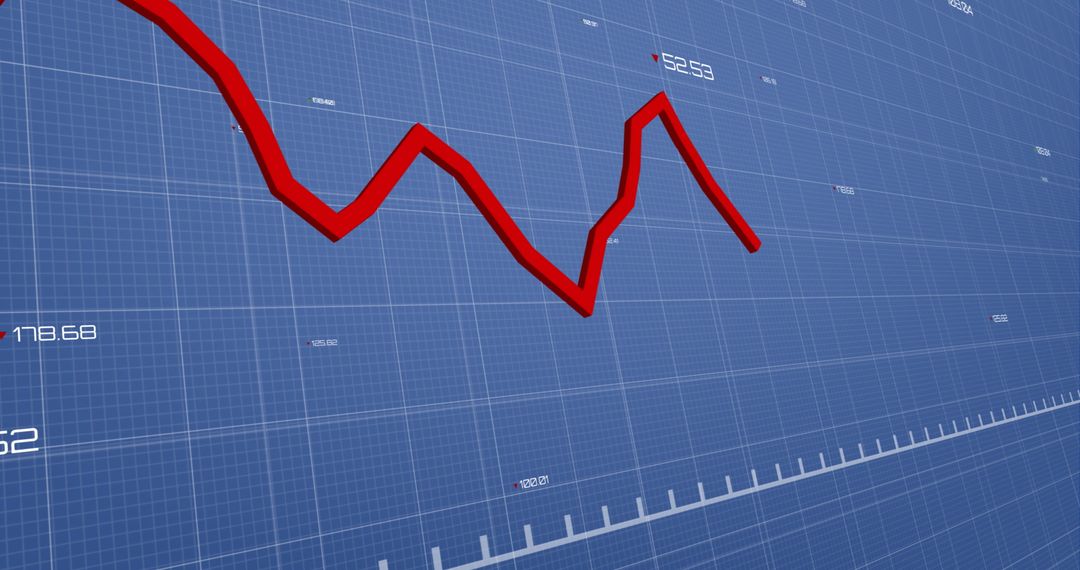
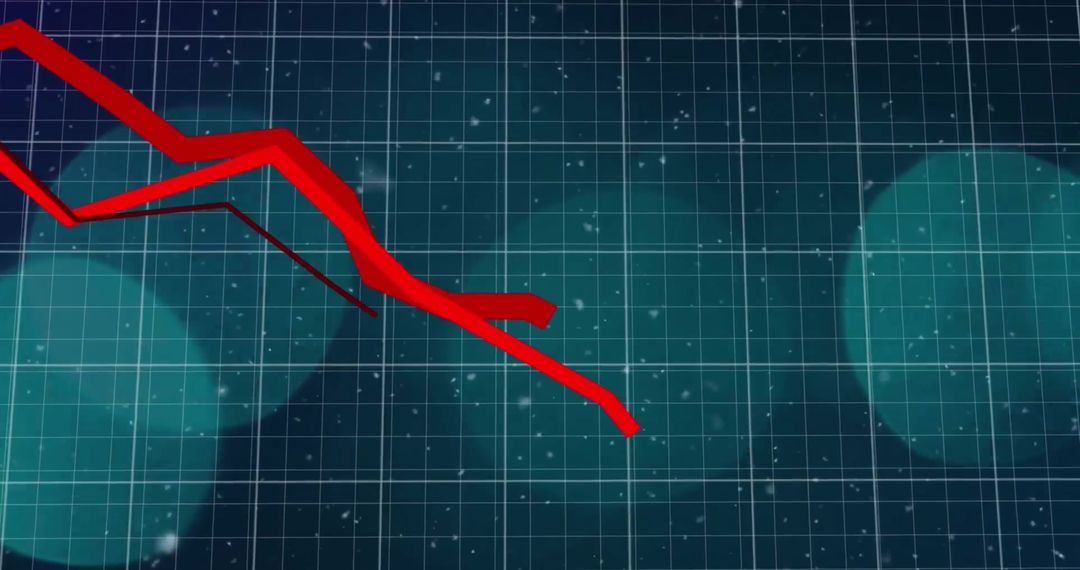
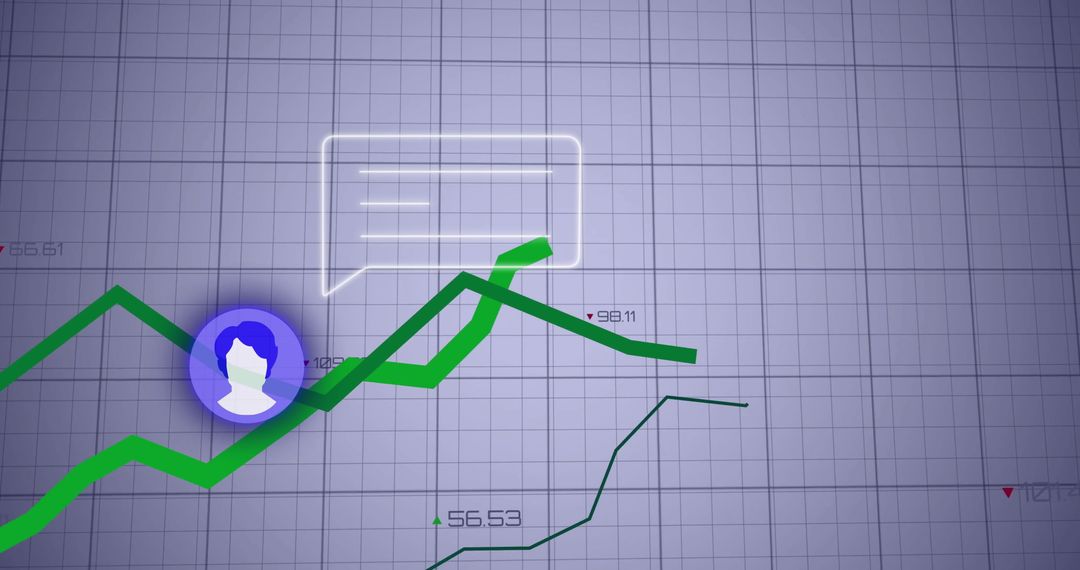
- Digital Graph with Neon Power Symbol Representing Economy Fluctuations
Digital Graph with Neon Power Symbol Representing Economy Fluctuations Image
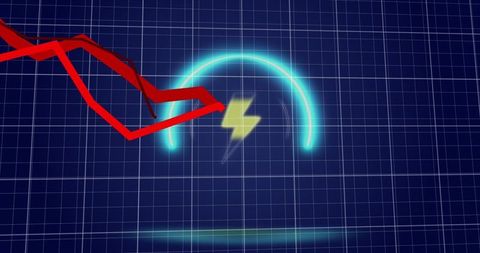
Digital representation of financial fluctuations with a neon energy symbol in background. Perfect for illustrating concepts of economic analysis, financial market trends, or energy sector insights. Ideal for financial blogs, market analysis reports, or tech trend articles.
Powered by  - Get 15% off with code: PIKWIZARD15


2
downloads
downloads
Tags:
More
Credit Photo
If you would like to credit the Photo, here are some ways you can do so
Text Link
photo Link
<span class="text-link">
<span>
<a target="_blank" href=https://pikwizard.com/photo/digital-graph-with-neon-power-symbol-representing-economy-fluctuations/a157e478e075f3ee77231c6a2619acfa/>PikWizard</a>
</span>
</span>
<span class="image-link">
<span
style="margin: 0 0 20px 0; display: inline-block; vertical-align: middle; width: 100%;"
>
<a
target="_blank"
href="https://pikwizard.com/photo/digital-graph-with-neon-power-symbol-representing-economy-fluctuations/a157e478e075f3ee77231c6a2619acfa/"
style="text-decoration: none; font-size: 10px; margin: 0;"
>
<img src="https://pikwizard.com/pw/medium/a157e478e075f3ee77231c6a2619acfa.jpg" style="margin: 0; width: 100%;" alt="" />
<p style="font-size: 12px; margin: 0;">PikWizard</p>
</a>
</span>
</span>
Free (free of charge)
Free for personal and commercial use.
Author: Authentic Images
Similar Free Stock Images

Premium


Premium


Premium


Premium