
- Home >
- Stock Photos >
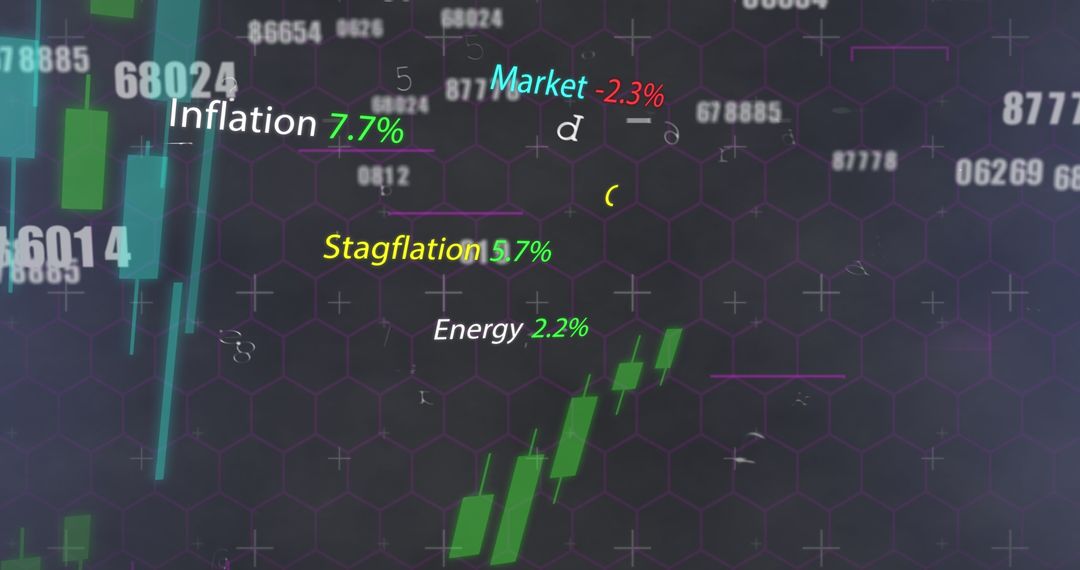
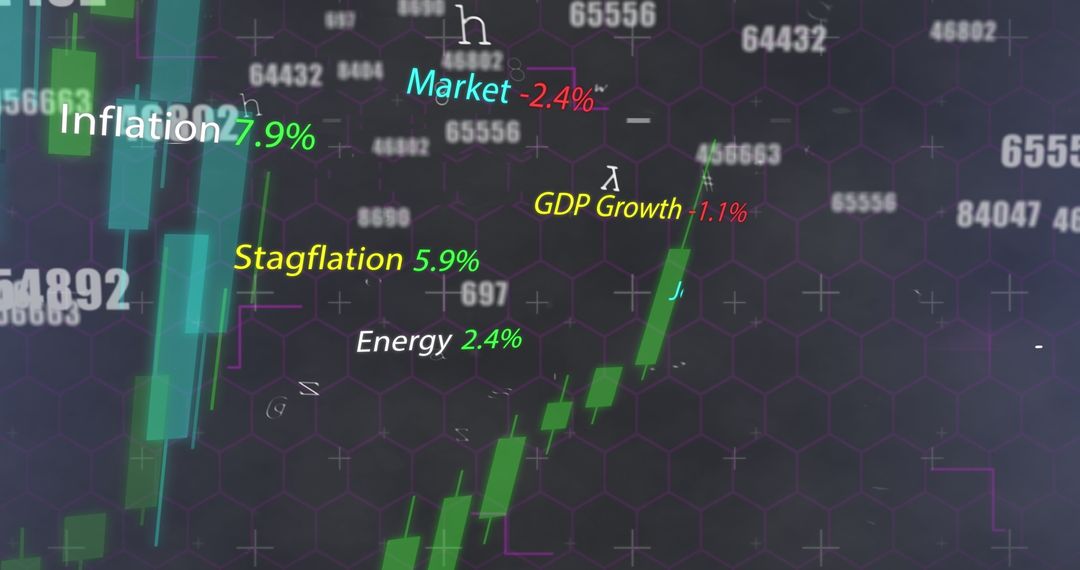
- Digital Graphs Display Financial Stock Market Data Trends Analysis
Digital Graphs Display Financial Stock Market Data Trends Analysis Image

Digital graphs showcasing stock market data are essential for gaining insights into financial trends and investment opportunities. These colorful visualizations assist professionals and traders in analyzing the complex data within the financial sector. Perfect for use in financial technology blogs, stock market education resources, and business reports, offering a comprehensive view of current economic statuses.
Powered by 


2
downloads
downloads
Tags:
More
Credit Photo
If you would like to credit the Photo, here are some ways you can do so
Text Link
photo Link
<span class="text-link">
<span>
<a target="_blank" href=https://pikwizard.com/photo/digital-graphs-display-financial-stock-market-data-trends-analysis/72dbfd540d8a3f381629f2edd716e201/>PikWizard</a>
</span>
</span>
<span class="image-link">
<span
style="margin: 0 0 20px 0; display: inline-block; vertical-align: middle; width: 100%;"
>
<a
target="_blank"
href="https://pikwizard.com/photo/digital-graphs-display-financial-stock-market-data-trends-analysis/72dbfd540d8a3f381629f2edd716e201/"
style="text-decoration: none; font-size: 10px; margin: 0;"
>
<img src="https://pikwizard.com/pw/medium/72dbfd540d8a3f381629f2edd716e201.jpg" style="margin: 0; width: 100%;" alt="" />
<p style="font-size: 12px; margin: 0;">PikWizard</p>
</a>
</span>
</span>
Free (free of charge)
Free for personal and commercial use.
Author: Authentic Images
Similar Free Stock Images

Premium


Premium


Premium


Premium


Premium


Premium


Premium


Premium


Premium


Premium


Premium


Premium


Premium


Premium


Premium


Premium


Premium


Premium


Premium


Premium


Premium


Premium


Premium


Premium

