- Home >
- Stock Photos >
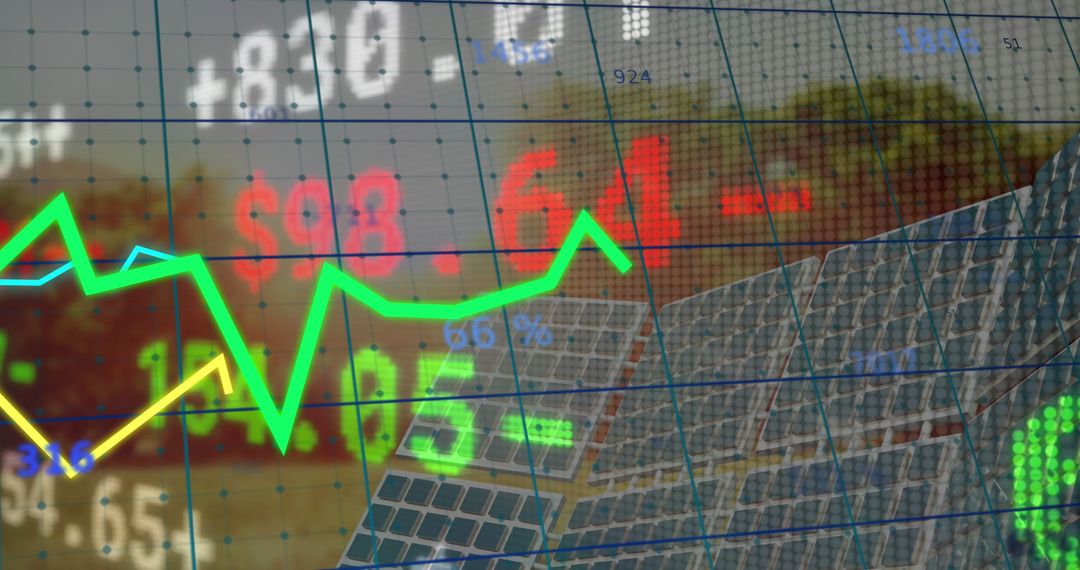
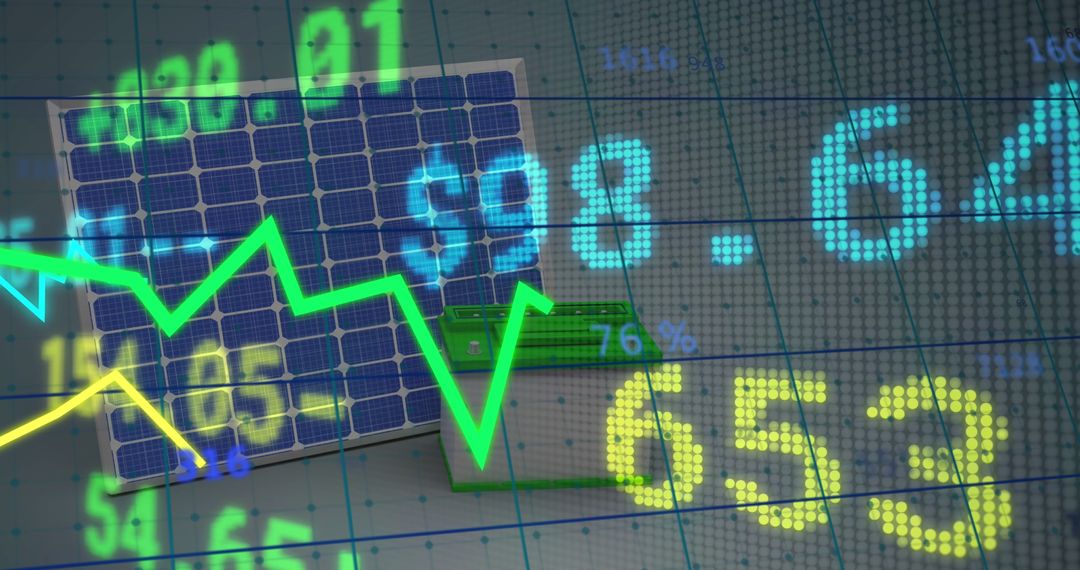
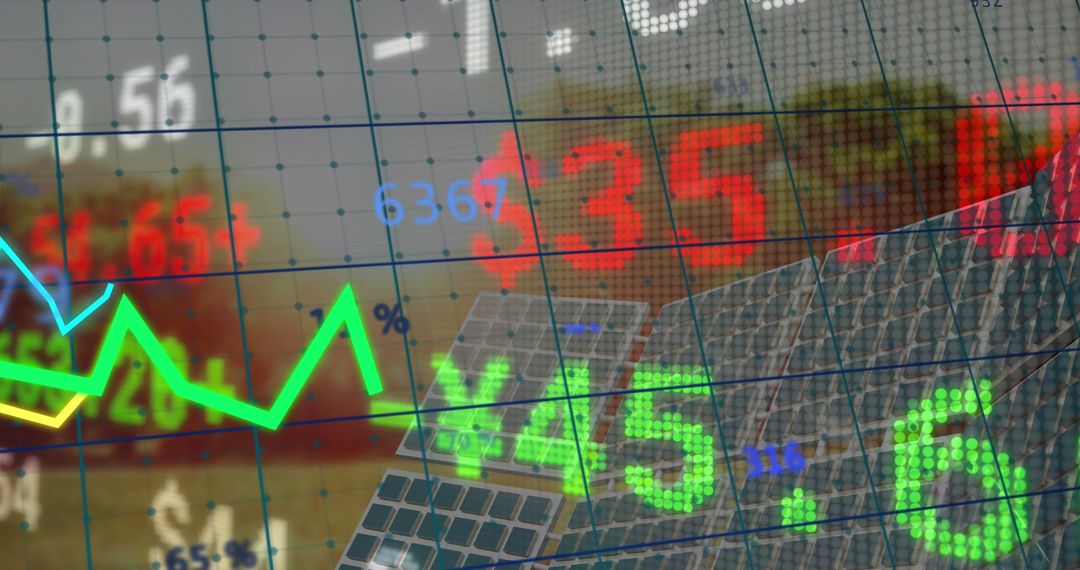
- Digital Graphs Indicating Stock Market Data Trends
Digital Graphs Indicating Stock Market Data Trends Image

This depiction features vibrant digital graphs and data points reflecting real-time stock market trends, suitable for illustrating concepts related to financial analysis and global economic movements. Ideal for business reports, financial websites, and presentations addressing market forecasts and analytics.
Powered by  - Get 15% off with code: PIKWIZARD15


2
downloads
downloads
Tags:
More
Credit Photo
If you would like to credit the Photo, here are some ways you can do so
Text Link
photo Link
<span class="text-link">
<span>
<a target="_blank" href=https://pikwizard.com/photo/digital-graphs-indicating-stock-market-data-trends/bae78fb8866125da732886cfdf700202/>PikWizard</a>
</span>
</span>
<span class="image-link">
<span
style="margin: 0 0 20px 0; display: inline-block; vertical-align: middle; width: 100%;"
>
<a
target="_blank"
href="https://pikwizard.com/photo/digital-graphs-indicating-stock-market-data-trends/bae78fb8866125da732886cfdf700202/"
style="text-decoration: none; font-size: 10px; margin: 0;"
>
<img src="https://pikwizard.com/pw/medium/bae78fb8866125da732886cfdf700202.jpg" style="margin: 0; width: 100%;" alt="" />
<p style="font-size: 12px; margin: 0;">PikWizard</p>
</a>
</span>
</span>
Free (free of charge)
Free for personal and commercial use.
Author: Creative Art
Similar Free Stock Images

Premium


Premium


Premium


Premium


Premium


Premium


Premium


Premium


Premium


Premium


Premium


Premium


Premium


Premium


Premium


Premium


Premium


Premium


Premium


Premium


Premium


Premium


Premium


Premium