- Home >
- Stock Photos >
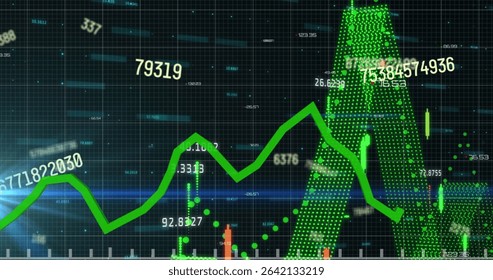
- Digital Green Line Graph Over Grid with Statistics and Numbers
Digital Green Line Graph Over Grid with Statistics and Numbers Image

This digital representation of a green line graph on a grid weave presents an abstract yet functional view, depicting fluctuating statistical data with accompanying numbers. Great for use in financial reports, business presentations, data analysis overviews, and technology demonstrations. Its high-tech feel can visually enhance concepts surrounding dynamics of business performance and market research.
Powered by  - Get 15% off with code: PIKWIZARD15


0
downloads
downloads
Tags:
More
Credit Photo
If you would like to credit the Photo, here are some ways you can do so
Text Link
photo Link
<span class="text-link">
<span>
<a target="_blank" href=https://pikwizard.com/photo/digital-green-line-graph-over-grid-with-statistics-and-numbers/41ea023e63418e2142c1da9d919ca259/>PikWizard</a>
</span>
</span>
<span class="image-link">
<span
style="margin: 0 0 20px 0; display: inline-block; vertical-align: middle; width: 100%;"
>
<a
target="_blank"
href="https://pikwizard.com/photo/digital-green-line-graph-over-grid-with-statistics-and-numbers/41ea023e63418e2142c1da9d919ca259/"
style="text-decoration: none; font-size: 10px; margin: 0;"
>
<img src="https://pikwizard.com/pw/medium/41ea023e63418e2142c1da9d919ca259.jpg" style="margin: 0; width: 100%;" alt="" />
<p style="font-size: 12px; margin: 0;">PikWizard</p>
</a>
</span>
</span>
Free (free of charge)
Free for personal and commercial use.
Author: People Creations
Similar Free Stock Images

Premium


Premium


Premium


Premium


Premium


Premium


Premium


Premium


Premium


Premium


Premium


Premium


Premium


Premium


Premium


Premium


Premium


Premium


Premium


Premium


Premium


Premium


Premium


Premium