1. Home > 
  2. Stock Photos > 
  3. Digital Illustration of Financial Data with Market Trends

Digital Illustration of Financial Data with Market Trends Image

Digital Illustration of Financial Data with Market Trends

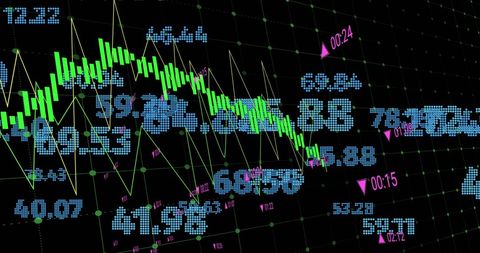
Digital representation shows fluctuating financial data with numbers and market trends over black background. Ideal for articles on economy, stock exchange predictions, business analysis, data presentation and financial industry concepts.

Powered by Adobe logo
Business growth and financial success illustrated by upward arrow and data - Powered by AdobeFuturistic digital stock market chart illustrates business data and technology with a blue binary code pattern background and connected network line design - Powered by AdobeFuturistic digital illustration of a stock market graph with city skyline background financial graph - Powered by AdobeClose-up of orange basketball on wood floor, blurred financial graph background, showcasing financial markets and sports business connection - Powered by AdobeAbstract digital stock market chart with glowing blue lines and bokeh effects representing financial growth and analysis - Powered by Adobe

Credit Photo

If you would like to credit the Photo, here are some ways you can do so

Free (free of charge)

Free for personal and commercial use.

Author: Awesome Content

Similar Free Stock Images

Financial Data Displayed Over City Skyline with Rising Graphs
Premium
3D graphic of a rising stock market graph with scattered coins, illustrating financial growth.
Digital Financial Data Overlaying City Skyline at Dusk
World Map with Falling Line Graphs Indicating Global Economic Decline
Futuristic Data Visualization with Financial Statistics
Futuristic Global Business Data with Digital Interface
Premium
Analyze dynamic stock market trends using vibrant financial charts for modern business reports and investment strategies, offering data insights
Dynamic Stock Market Graph Displaying Surging Growth
Dynamic Data Graphs on Digital Interface Background
Digital Representation of Slumpflation in Global Economy
Dynamic Financial Charts and Graphs Indicating Market Trends
Premium
Growing financial graph showcasing stock market success and economic progress in a futuristic green toned setting with financial data monitors
Dynamic Digital Market Analysis with Holographic Data
Futuristic Digital Network with Data Streams and Connections
Analyzing Financial Graphs with Real-Time Data Trends
Dynamic Stock Market Data Analysis on Blue Grid Background
Premium
Global stock market economy with modern blue background and data analysis
Financial Graphs with Social Media Analytics on Digital Chart
Colorful Financial Data Analytics and Global Market Trends
Abstract Futuristic Data Network and Digital Finance Concept
Data Visualization on Security Shield Interface for Cyber Security
Premium
Large screen display showing various business graphs and charts.
Data Visualization on Blue Digital Interface
Abstract Financial Data Analysis and Stock Market Trends
Financial Data Analysis on Blue Digital Interface
Global Business Finance Data Analysis Visualization
Premium
Abstract data tunnel with stock market charts and currency symbols on digital binary code light streaks background
Digital Financial Data Illustration with Neon Graphs and Nodes
Digital Financial Data Analysis on Grid Framework
Financial Data with Molecular Background Concept
Dynamic Financial Data with Fluctuating Graph Lines
Dynamic Financial Market Graph Amidst Digital Equations
Digital Financial Data and Global Business Analytics
Premium
transparent background stock market and forex trading chart with green growing arrow, financial data and investment success concept
Digital Network with Financial and Business Icons in Interconnected Web
Financial Data Flow against Urban Skyline Backdrop
Futuristic Data Processing Animation with Media Icons
Financial Data Charts in Shimmering Blue Digital Space
Premium
Wireframe hand holding magnifying glass over glowing digital stock market graph analysis business
Digital Concept of Stagflation with Chart and Globe Illustration
Stagflation Headlines with Digital World Map and Graph
European Market Data Overlay with EU Flag and Financial Graphs
Global Finance and COVID-19 Impact Representation
Premium
Global Stock Market Analysis: Visualizing Financial Trends on Earth Map
Financial Data Visualization in Server Room Setting
Digital Financial Data Processing with Graphs and Charts
Dynamic Forex Trading Graphs with Increasing Numbers
Dynamic Financial Data Analysis in Digital Interface
Premium
Analysis of stock market data displayed with financial chart
Dynamic Data Processing Concept in Digital Interface Design
Digital Graph with Rising and Falling Lines on Grid Background
Global Financial Technology Network and Data Analytics
Digital Cityscape with Financial Data Overlay
Premium
Financial market data analysis with glowing 3D bar and line charts on dark background showing economic trends and growth concept visualization. 3D Rendering
Financial Data Analysis Vibrant Graphs on Blue Background
Financial Data Graph with Digital Elements and Growth Indicators
Global Financial Data on Virtual Screen Displaying Stock Market Trends
Dynamic Financial Data with Overlaid Cityscape Interface
Premium
stock market chart of business increase stock graph investment financial data profit on growth money diagram success trading graph diagram
Financial Data Analysis with Growing Stock Trends
Innovative Data Analysis over DNA Strand
Modern Technology Network with Financial Data Visualization
Rising Stock Market Trend with Digital Data Analytics
Financial Data Analysis with Growth Trend Arrows on Digital Interface
Financial Data Visualization with Cityscape Overlay
Premium
Colorful abstract graph showing upward financial growth and data analysis
Data Analytics and Financial Growth Indicators
Digital Data Analytics Overlay on Cityscape
Falling Stock Market Graph with Data on Black Screen
Digital Data Visualization with Growth Arrow and Graphs
Premium
Abstract blue digital background with financial chart, bar graph, and arrow illustrating market growth, success, and business finance data report concept
Cryptocurrency Data with Digital Analytics Overlay
Financial Data Analysis Displayed on Server Infrastructure
Financial Data Visualization and Digital Analysis Concept
Abstract Financial Graphs with Rising Trends and Positive Indicators
Premium
Digital forex and stock market chart with upward arrows and glowing data on dark screen background showing financial growth trends. 3D Rendering
Visual Display of Abstract Financial Data
Dynamic Analysis of Stock Market Trends and Patterns
Dynamic Financial Data with Graph Trends and Statistics
Dynamic Financial Data Visualization on Digital Grid Background
Premium
Abstract financial chart with bokeh
Global Data Processing on Digital Earth Background
Dynamic Financial Data Against Urban Skyline
Analyzing Financial Data with Business Charts Against Urban Skyline
Data Visualization on Digital Grid with Technological Interface
Premium
Abstract blue background vector illustration with upward arrows symbolizing business progress, financial growth, and market success
Digital Data and Financial Charts on White Background
Analyzing Financial Data on Digital World Map Background
Digital Data Analytics on Blue Grid Background
Global Financial Data Analysis with Colorful Graphs
Premium
Abstract cityscape with financial stock market charts and data visualization urban
Global Stock Market Analysis with Digital Interface Over World Map
Dynamic Graphic of Financial Data Displayed on Graph
Dynamic Financial Data Graphs Networking in Global Business
Financial Data Overlay on Cityscape Visualizing Market Trends
Dynamic Financial Graphs Over Cityscape Background
Abstract Financial Market Data Analysis Visualization
Premium
Hand interacting a glowing stock market graph on a digital screen, illustrating financial data investment trends
Futuristic Data Processing and Global Business Network
Dynamic Financial Graph on Digital Background
Dynamic Stock Market Graphs and Financial Data
Economic Slumpflation Display on Digital Graph
Premium
A 3d stock market chart with an upward arrow illustrates financial growth and business success
Digital Graphs Representing Data and Analytics on Black Background
Dynamic Financial Data Chart Display with Graphical Analysis
Digital Financial Data Visualization with Graphs and Charts
Abstract Digital Financial Data Chart with Pink Line Oscillations
Premium
Abstract financial stock market graph with candlestick bars isolated on transparent background
Digital Stock Market Analysis with Graphs and Charts
Cybernetic Data Flow with Digital Network Connections
Abstract Financial Data Visualization with Graphs
Graphical Data Analysis on Digital Interface
Premium
A glowing blue arrow pointing upwards on an abstract bar graph symbolizing growth and business success in the digital world with a futuristic background.
Dynamic Financial Graphs and Data Analysis Interface
Abstract Data Visualization on Blue Background for Technology Concept
Data Analysis Graphics on Digital Grid Background
Financial Data Analysis with Abstract Chart Grid Overlay
Premium
Abstract digital stock market chart with glowing blue lines and bokeh effects representing financial growth and analysis
Data Visualization on Digital Interface with Graphs and Codes
Tech Growth Analysis with Dynamic Data Visualization
Financial Data Visualization on World Map with Graph Analytics
Abstract Financial Data Processing and Analysis Interface
Premium
Canadian flag overlayed on stock market data showing economic trends and financial performance
Digital Financial Data Graph on Black Screen Background