- Home >
- Stock Photos >
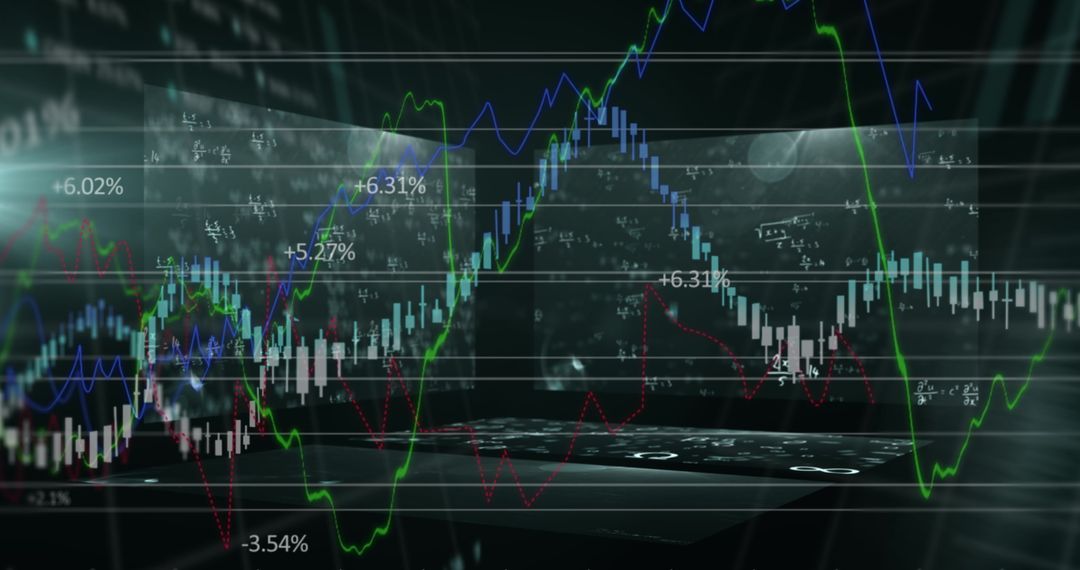
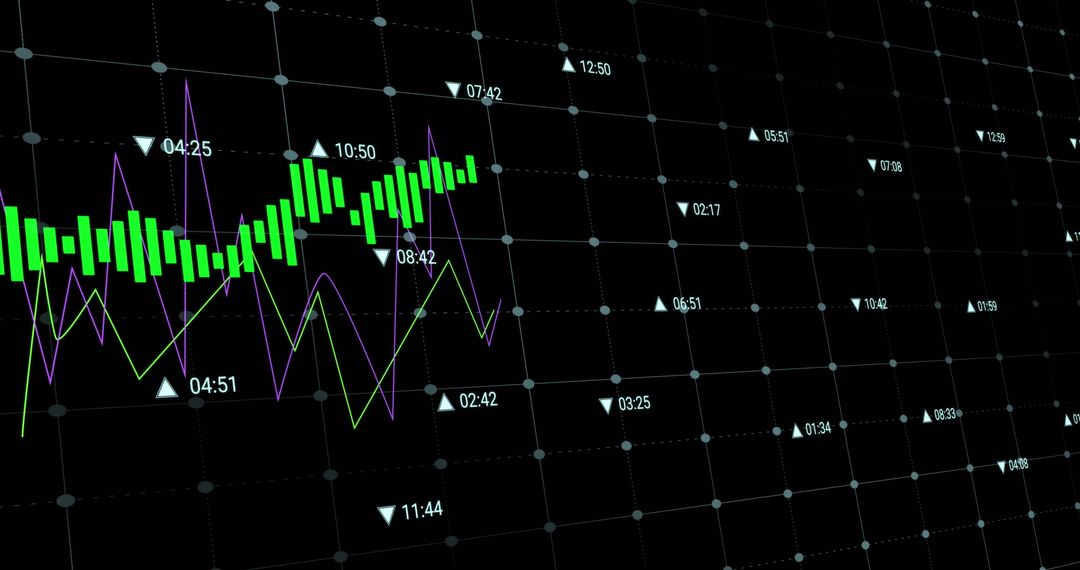
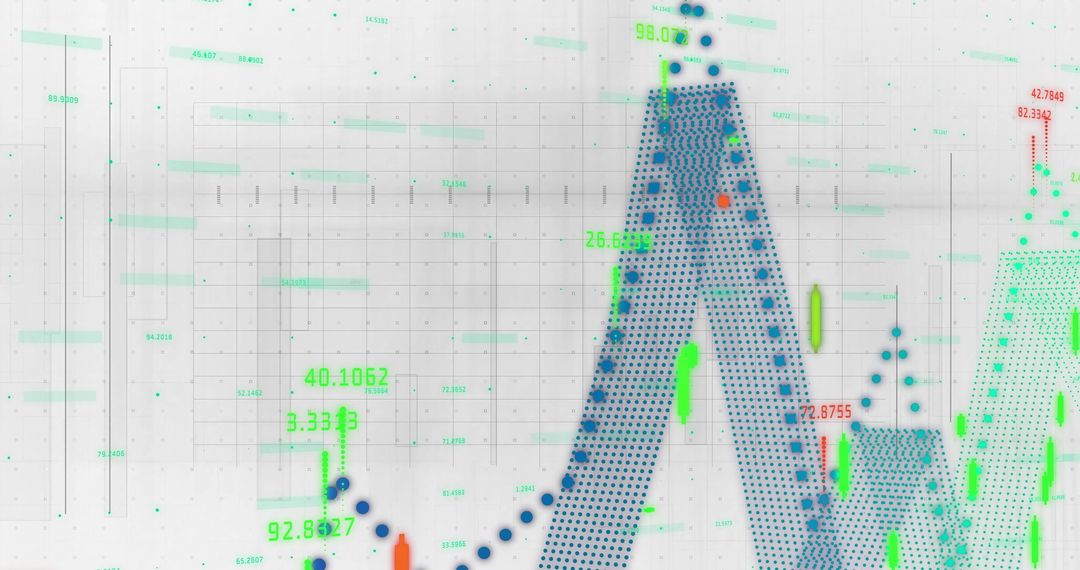
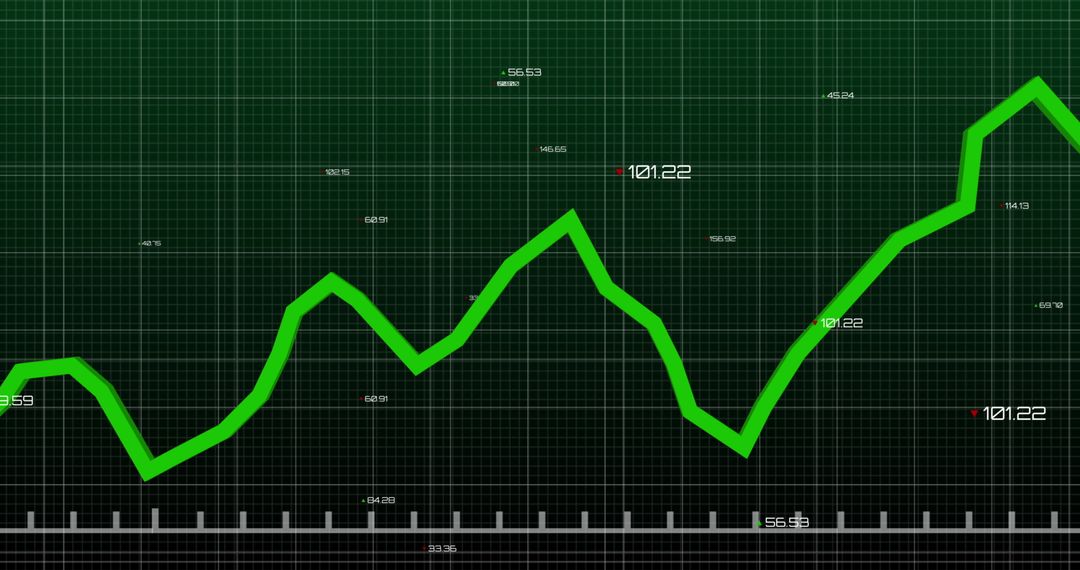
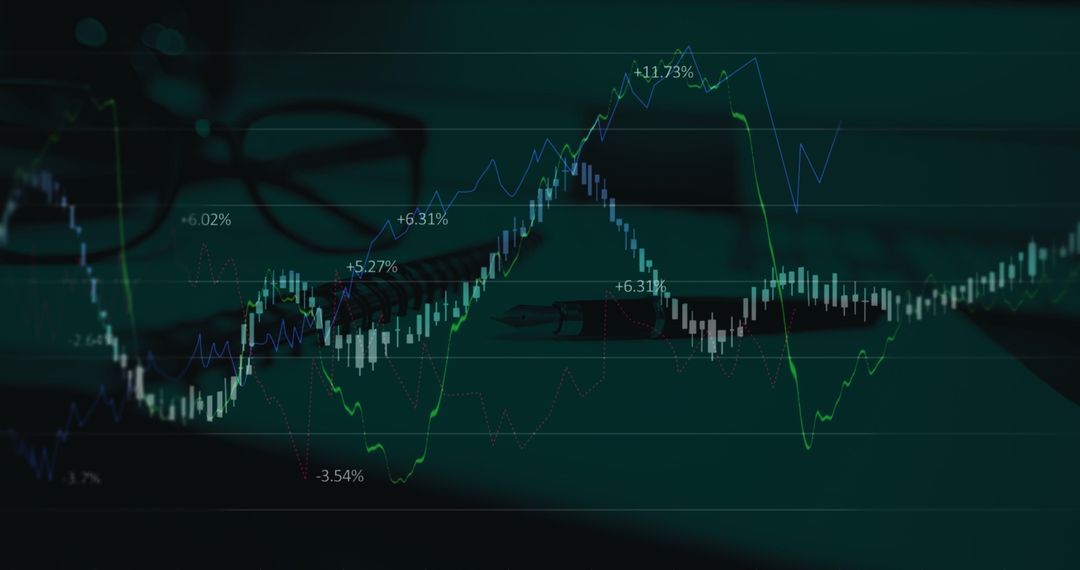
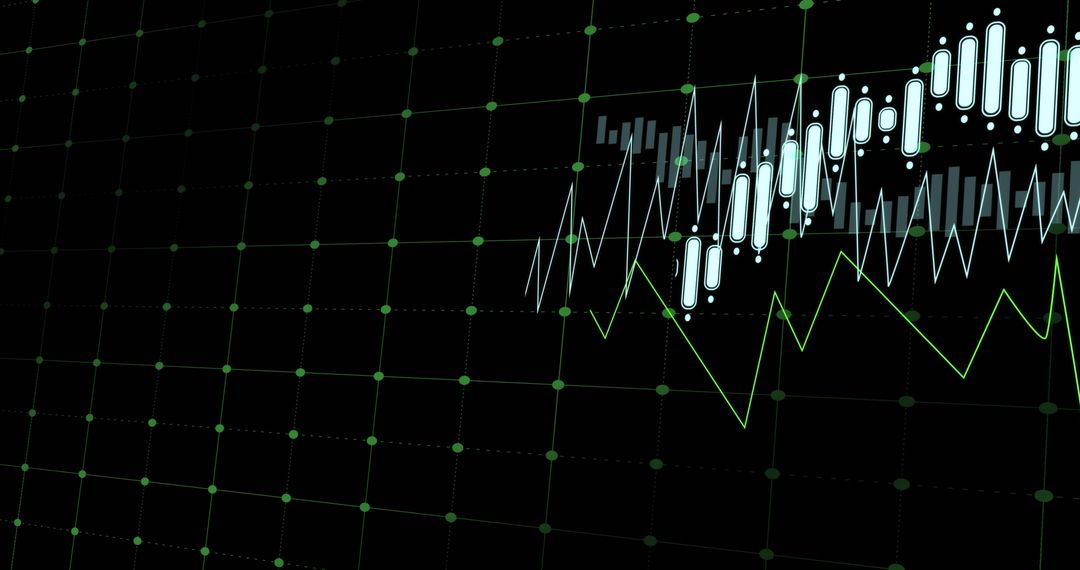
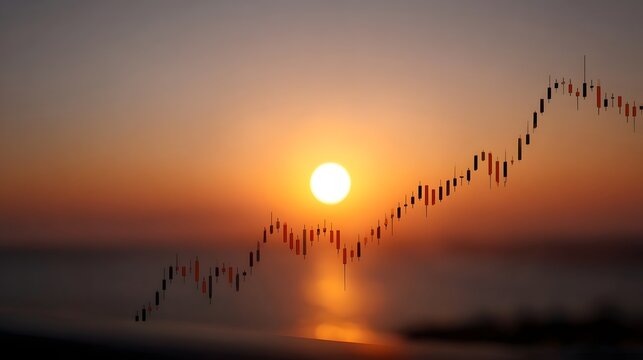
- Digital Interface Displaying Financial Market Trends
Digital Interface Displaying Financial Market Trends Image

Dynamic visualization of financial market trends uses candlestick patterns, colorful trend lines, and numerical data. Suitable for illustrating investment strategies, stock market analysis, or any technological content involving financial analytics.
Powered by 


2
downloads
downloads
Tags:
More
Credit Photo
If you would like to credit the Photo, here are some ways you can do so
Text Link
photo Link
<span class="text-link">
<span>
<a target="_blank" href=https://pikwizard.com/photo/digital-interface-displaying-financial-market-trends/4388b270dd76e9b5fe84259fca6d3600/>PikWizard</a>
</span>
</span>
<span class="image-link">
<span
style="margin: 0 0 20px 0; display: inline-block; vertical-align: middle; width: 100%;"
>
<a
target="_blank"
href="https://pikwizard.com/photo/digital-interface-displaying-financial-market-trends/4388b270dd76e9b5fe84259fca6d3600/"
style="text-decoration: none; font-size: 10px; margin: 0;"
>
<img src="https://pikwizard.com/pw/medium/4388b270dd76e9b5fe84259fca6d3600.jpg" style="margin: 0; width: 100%;" alt="" />
<p style="font-size: 12px; margin: 0;">PikWizard</p>
</a>
</span>
</span>
Free (free of charge)
Free for personal and commercial use.
Author: People Creations