- Home >
- Stock Photos >
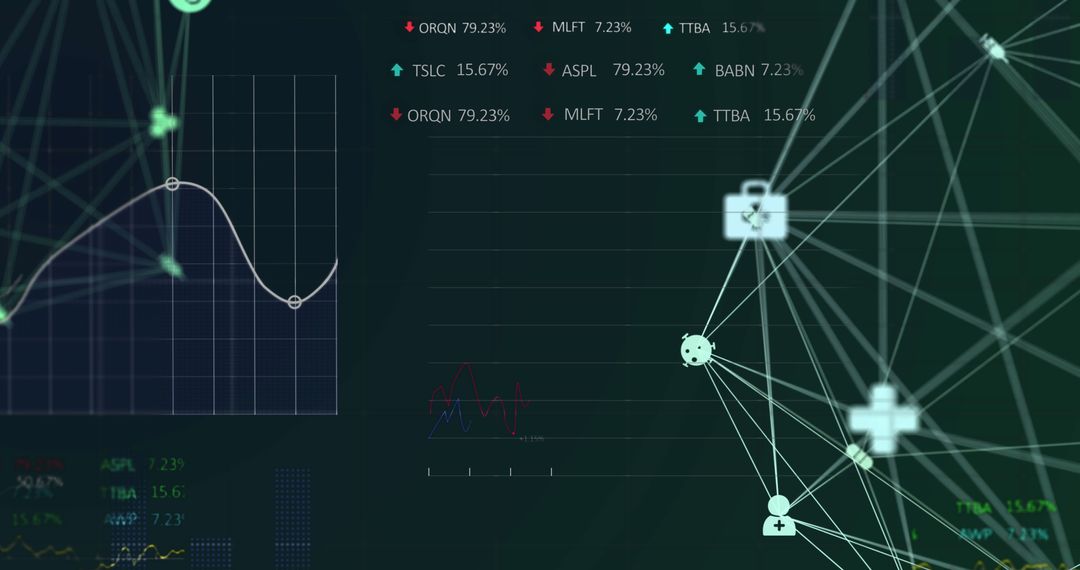
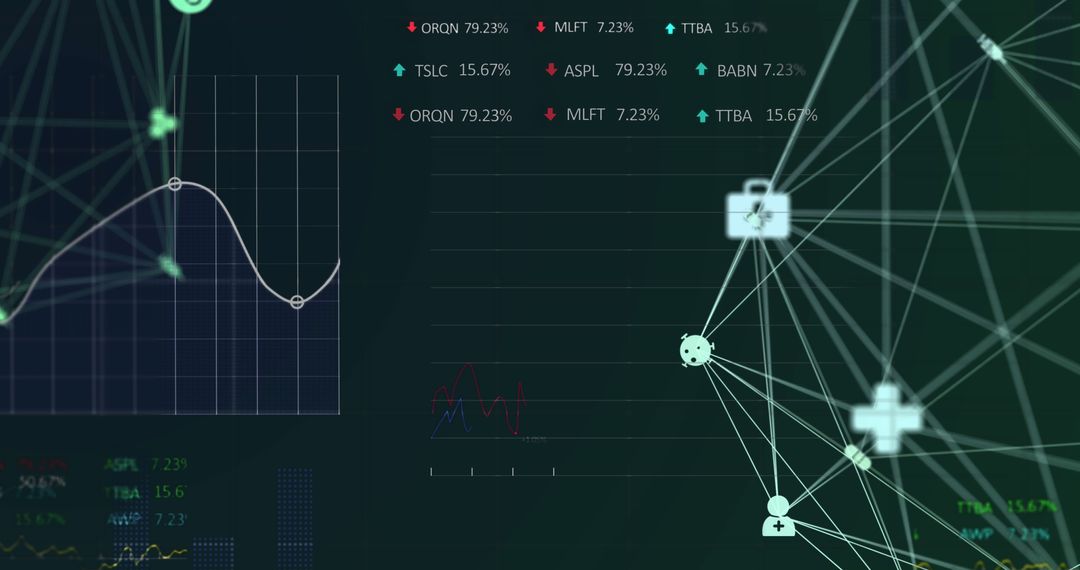
- Digital Interface Displaying Social Media Engagement over Stock Trends
Digital Interface Displaying Social Media Engagement over Stock Trends Image

Interface showcasing blend of stock market trends and digital engagement analytics. Useful for illustrating digital transformation in financial analytics. Suitable for education, technology companies, marketing strategies, or investor presentations focusing on the impact of digital tools on traditional markets.
Powered by 


2
downloads
downloads
Tags:
More
Credit Photo
If you would like to credit the Photo, here are some ways you can do so
Text Link
photo Link
<span class="text-link">
<span>
<a target="_blank" href=https://pikwizard.com/photo/digital-interface-displaying-social-media-engagement-over-stock-trends/fb29badff53b74f39187a37a4a27f649/>PikWizard</a>
</span>
</span>
<span class="image-link">
<span
style="margin: 0 0 20px 0; display: inline-block; vertical-align: middle; width: 100%;"
>
<a
target="_blank"
href="https://pikwizard.com/photo/digital-interface-displaying-social-media-engagement-over-stock-trends/fb29badff53b74f39187a37a4a27f649/"
style="text-decoration: none; font-size: 10px; margin: 0;"
>
<img src="https://pikwizard.com/pw/medium/fb29badff53b74f39187a37a4a27f649.jpg" style="margin: 0; width: 100%;" alt="" />
<p style="font-size: 12px; margin: 0;">PikWizard</p>
</a>
</span>
</span>
Free (free of charge)
Free for personal and commercial use.
Author: Creative Art
Similar Free Stock Images

Premium


Premium


Premium


Premium


Premium


Premium


Premium


Premium


Premium


Premium


Premium


Premium


Premium


Premium


Premium


Premium


Premium


Premium


Premium


Premium


Premium


Premium


Premium


Premium