- Home >
- Stock Photos >
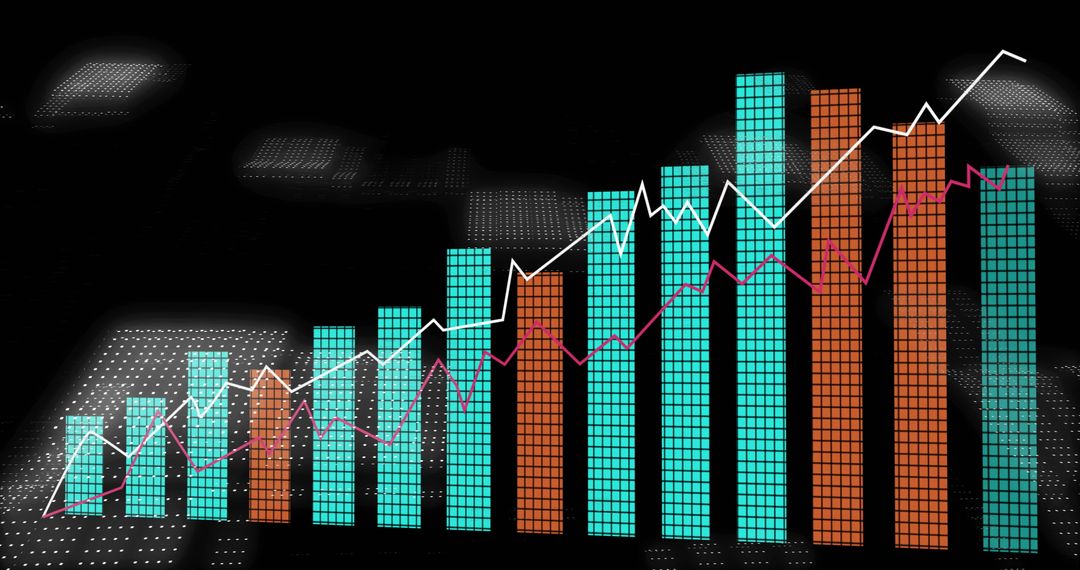
- Digital Market Dashboard Showing Rising Bars Teal White Line Red Arrow Magenta Line
Digital Market Dashboard Showing Rising Bars Teal White Line Red Arrow Magenta Line Image

Showing digital market dashboard with rising teal and orange tiled bars, white trend line and magenta secondary line against red grid background with bold red arrow suggesting upward momentum and volatility. Featuring pixelated tile texture and layered grid for high-tech visual appeal, creating dynamic sense of growth and data movement. Ideal for financial reports, market analysis articles, business presentations, investor pitch decks, fintech websites, trading app interfaces, social media posts and news graphics. Designers can use as header visual, background for data dashboards, overlay for charts and infographics, or attention-grabbing element for marketing materials and slide decks.
Powered by 


0
downloads
downloads
Tags:
More
Credit Photo
If you would like to credit the Photo, here are some ways you can do so
Text Link
photo Link
<span class="text-link">
<span>
<a target="_blank" href=https://pikwizard.com/photo/digital-market-dashboard-showing-rising-bars-teal-white-line-red-arrow-magenta-line/9e8a8ce4c748260cdd16b0e0957e7d24/>PikWizard</a>
</span>
</span>
<span class="image-link">
<span
style="margin: 0 0 20px 0; display: inline-block; vertical-align: middle; width: 100%;"
>
<a
target="_blank"
href="https://pikwizard.com/photo/digital-market-dashboard-showing-rising-bars-teal-white-line-red-arrow-magenta-line/9e8a8ce4c748260cdd16b0e0957e7d24/"
style="text-decoration: none; font-size: 10px; margin: 0;"
>
<img src="https://pikwizard.com/pw/medium/9e8a8ce4c748260cdd16b0e0957e7d24.jpg" style="margin: 0; width: 100%;" alt="" />
<p style="font-size: 12px; margin: 0;">PikWizard</p>
</a>
</span>
</span>
Free (free of charge)
Free for personal and commercial use.
Author: Creative Art
Similar Free Stock Images

Premium


Premium


Premium


Premium


Premium


Premium


Premium


Premium


Premium


Premium


Premium


Premium


Premium


Premium


Premium


Premium


Premium


Premium


Premium


Premium


Premium


Premium


Premium


Premium