
- Home >
- Stock Photos >
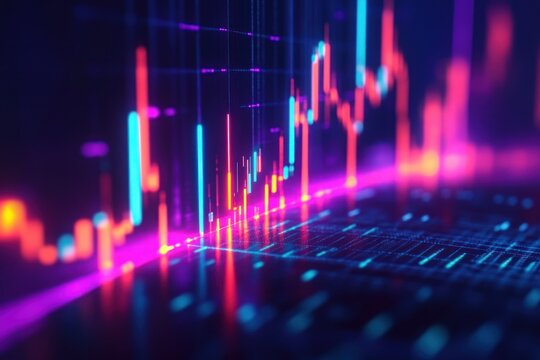
- Digital Market Trends with Candlestick Bars on Trading Dashboard
Digital Market Trends with Candlestick Bars on Trading Dashboard Image
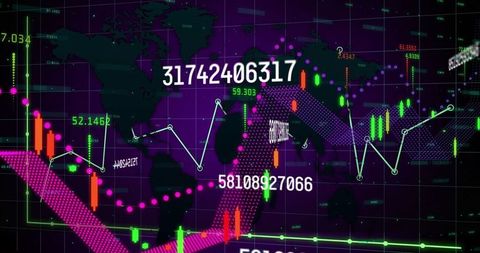
Visual representation captures dynamic market trends using candlestick bars on digital trading dashboard. Vibrant colors with digitized numbers convey energy of global financial analytics. Useful for presentations on investment strategies, online courses on trading, finance articles exploring data-driven analytics, or digital backgrounds for financial technology companies.
Powered by 


2
downloads
downloads
Tags:
More
Credit Photo
If you would like to credit the Photo, here are some ways you can do so
Text Link
photo Link
<span class="text-link">
<span>
<a target="_blank" href=https://pikwizard.com/photo/digital-market-trends-with-candlestick-bars-on-trading-dashboard/5762924435bcb7ea3a3ccd9ba302d484/>PikWizard</a>
</span>
</span>
<span class="image-link">
<span
style="margin: 0 0 20px 0; display: inline-block; vertical-align: middle; width: 100%;"
>
<a
target="_blank"
href="https://pikwizard.com/photo/digital-market-trends-with-candlestick-bars-on-trading-dashboard/5762924435bcb7ea3a3ccd9ba302d484/"
style="text-decoration: none; font-size: 10px; margin: 0;"
>
<img src="https://pikwizard.com/pw/medium/5762924435bcb7ea3a3ccd9ba302d484.jpg" style="margin: 0; width: 100%;" alt="" />
<p style="font-size: 12px; margin: 0;">PikWizard</p>
</a>
</span>
</span>
Free (free of charge)
Free for personal and commercial use.
Author: People Creations