- Home >
- Stock Photos >
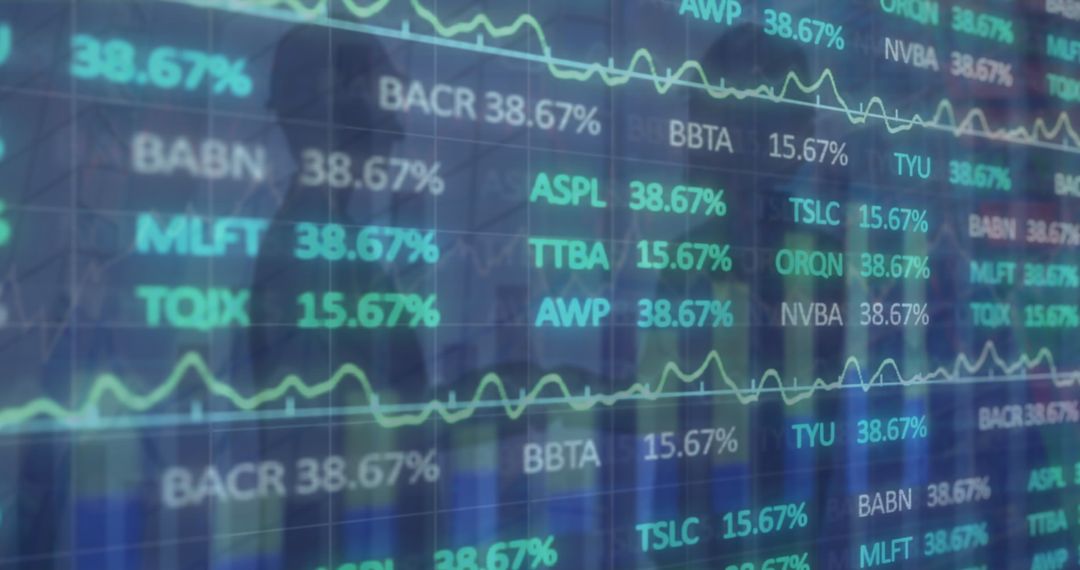
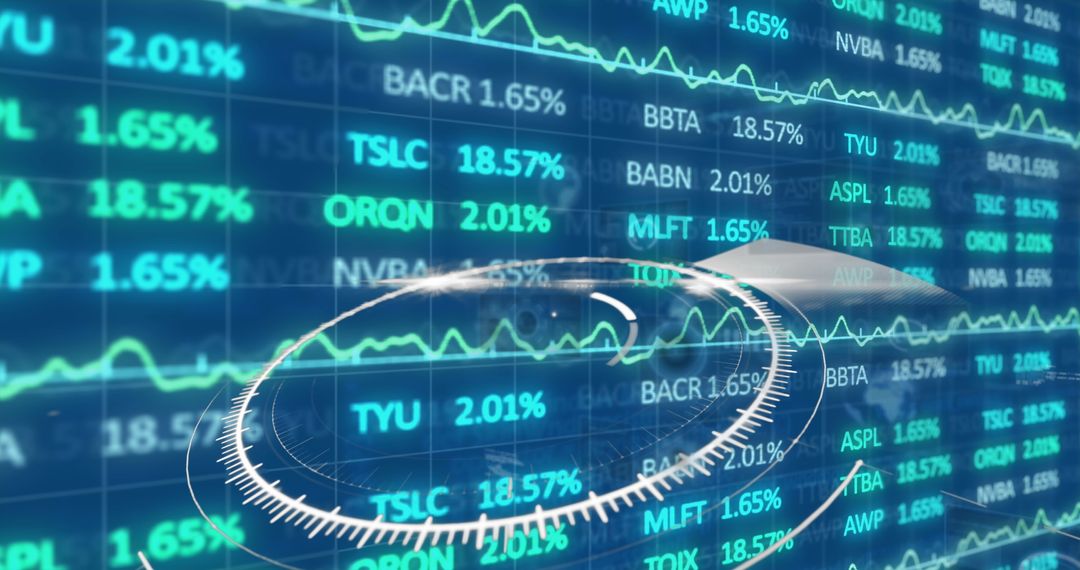
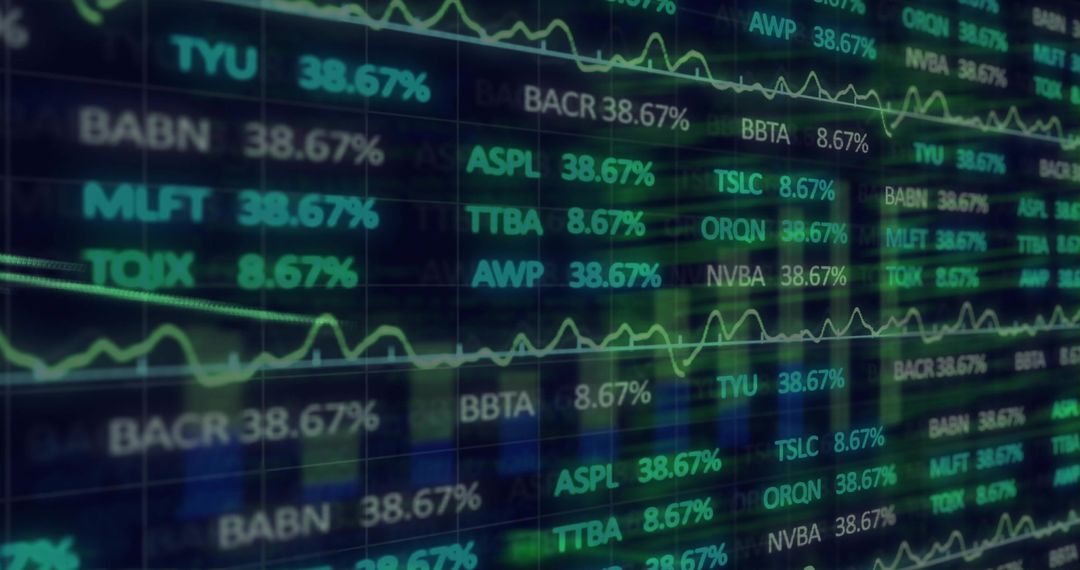
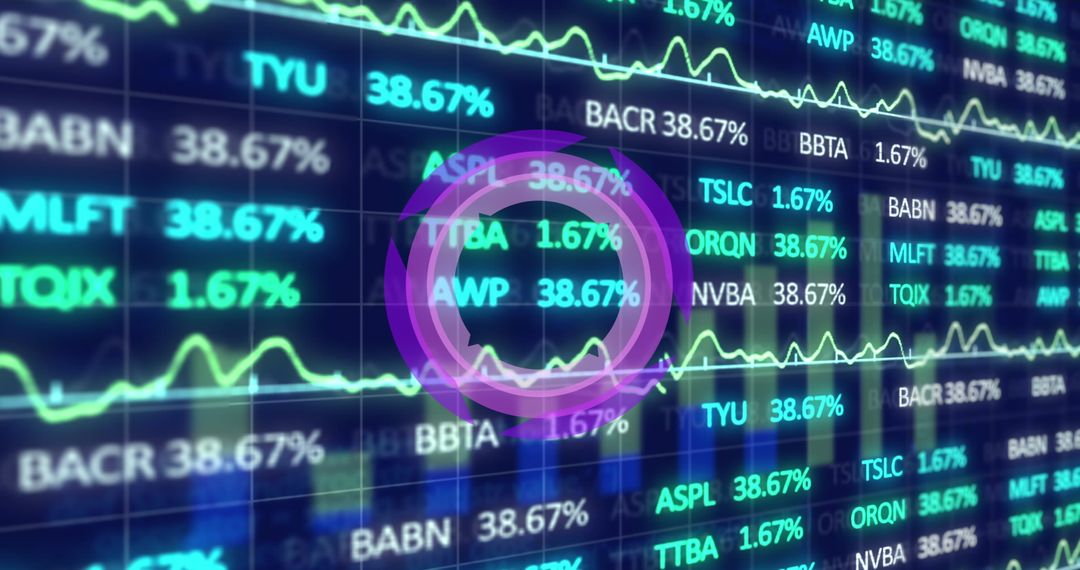
- Digital Radar Overlay on Financial Data and Stock Market Graphs
Digital Radar Overlay on Financial Data and Stock Market Graphs Image
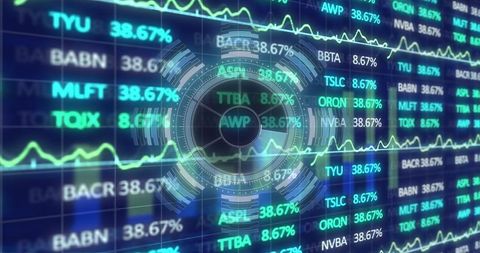
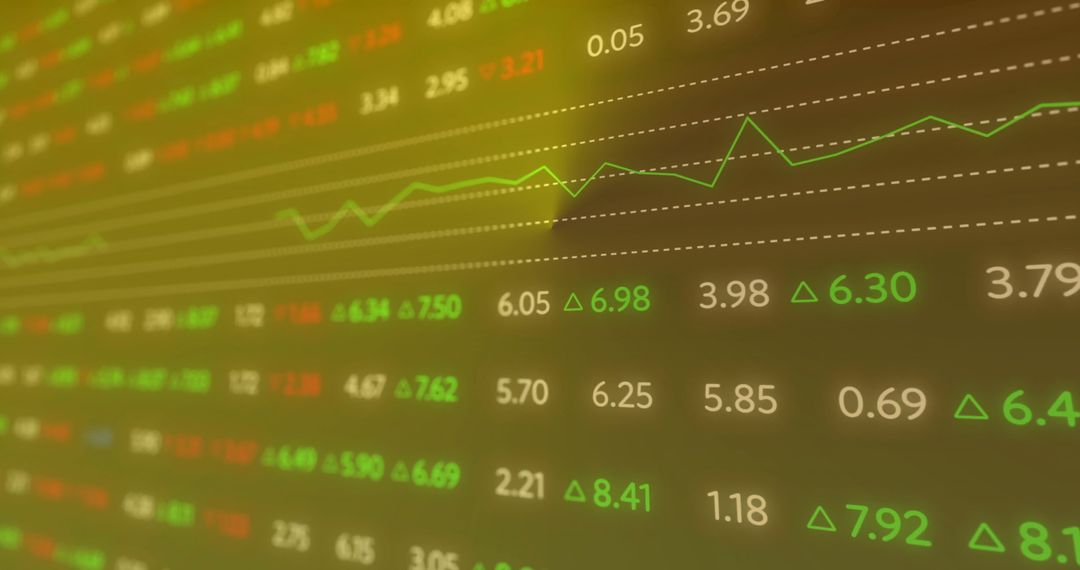
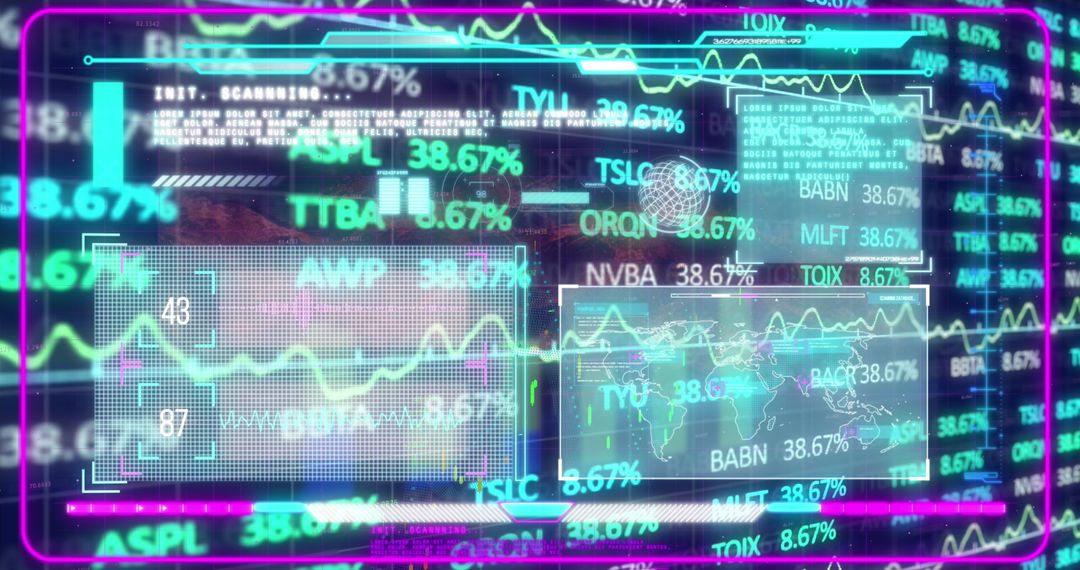
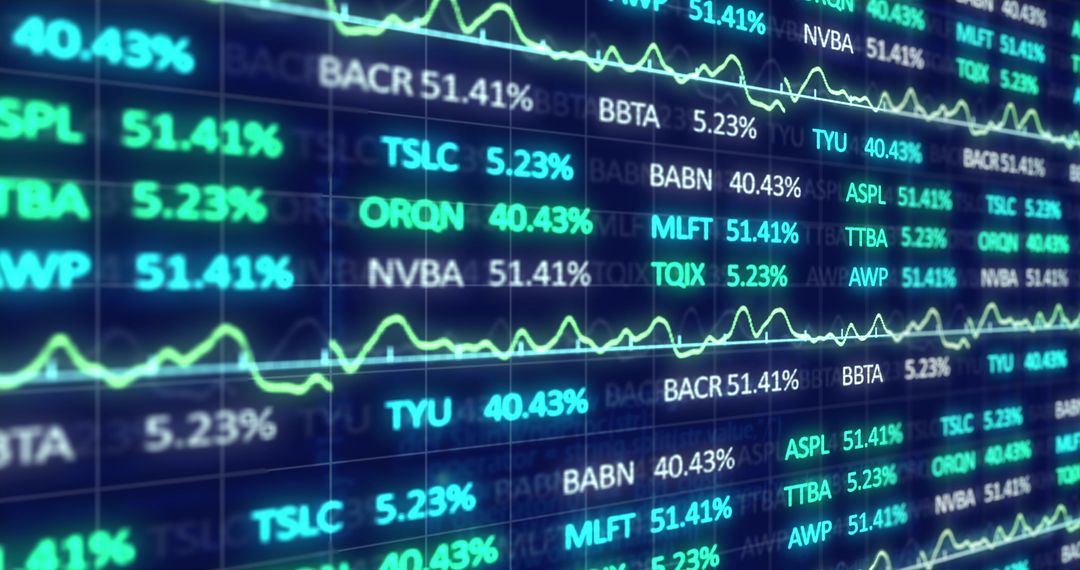
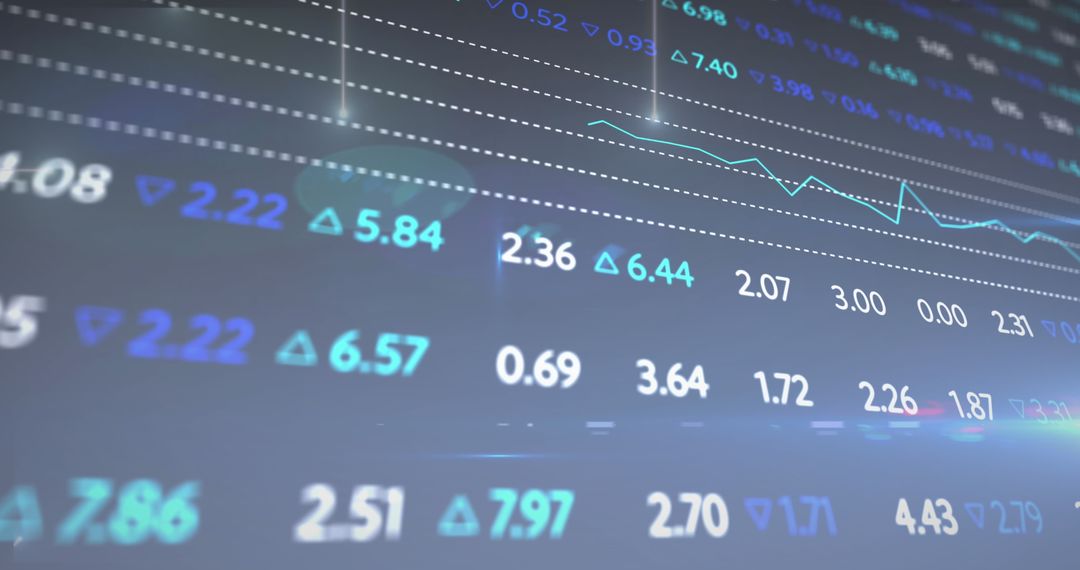
This visually dynamic image shows a digital radar display superimposed on financial data and stock market graphs, set against a navy background. The image conveys themes of financial analysis, technological advancement, and data-driven decision making. Ideal for use in technology and finance blogs, presentations about stock market trends, and educational material explaining data processing concepts.
Powered by 


2
downloads
downloads
Tags:
More
Credit Photo
If you would like to credit the Photo, here are some ways you can do so
Text Link
photo Link
<span class="text-link">
<span>
<a target="_blank" href=https://pikwizard.com/photo/digital-radar-overlay-on-financial-data-and-stock-market-graphs/99ed56e34994e70c6df27e5cff77f3a0/>PikWizard</a>
</span>
</span>
<span class="image-link">
<span
style="margin: 0 0 20px 0; display: inline-block; vertical-align: middle; width: 100%;"
>
<a
target="_blank"
href="https://pikwizard.com/photo/digital-radar-overlay-on-financial-data-and-stock-market-graphs/99ed56e34994e70c6df27e5cff77f3a0/"
style="text-decoration: none; font-size: 10px; margin: 0;"
>
<img src="https://pikwizard.com/pw/medium/99ed56e34994e70c6df27e5cff77f3a0.jpg" style="margin: 0; width: 100%;" alt="" />
<p style="font-size: 12px; margin: 0;">PikWizard</p>
</a>
</span>
</span>
Free (free of charge)
Free for personal and commercial use.
Author: People Creations
Similar Free Stock Images

Premium


Premium


Premium


Premium


Premium


Premium


Premium


Premium


Premium


Premium


Premium


Premium


Premium


Premium


Premium


Premium


Premium


Premium


Premium


Premium


Premium


Premium


Premium


Premium