- Home >
- Stock Photos >
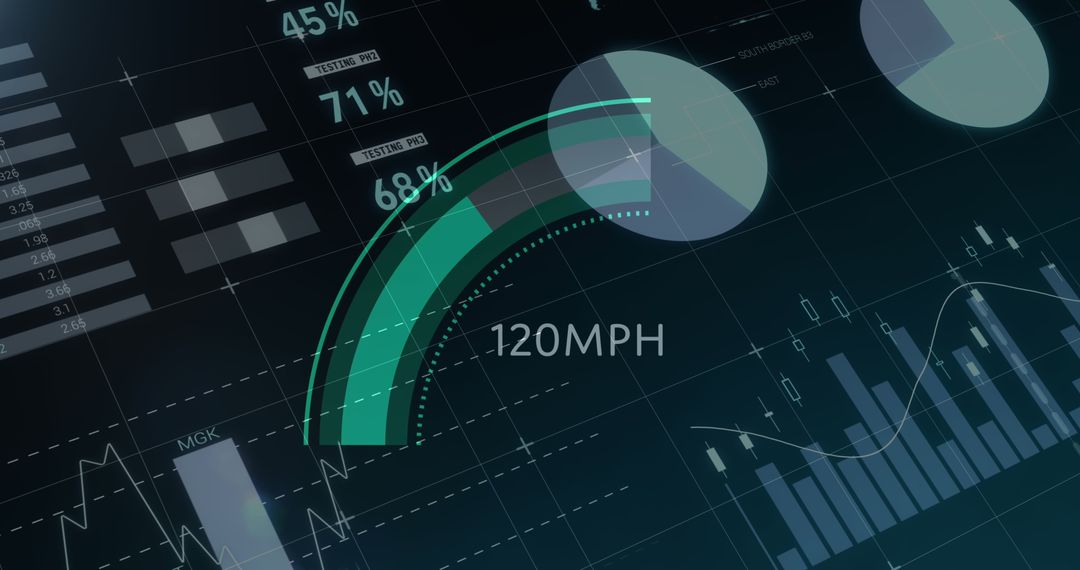
- Digital Real Estate Analytics with Charts and Global Data Visualization
Digital Real Estate Analytics with Charts and Global Data Visualization Image

Showcasing intersection of real estate and modern analytics, house symbol layered over complex analytics dashboard including bar charts, pie chart, and network graph with global perspective. Highlights advancements in understanding real estate market through data analysis. Ideal for publications on real estate trends, data-driven decision making, or technology in realty business.
Powered by 


2
downloads
downloads
Tags:
More
Credit Photo
If you would like to credit the Photo, here are some ways you can do so
Text Link
photo Link
<span class="text-link">
<span>
<a target="_blank" href=https://pikwizard.com/photo/digital-real-estate-analytics-with-charts-and-global-data-visualization/187a29dfb2dd44502880d9867f297c91/>PikWizard</a>
</span>
</span>
<span class="image-link">
<span
style="margin: 0 0 20px 0; display: inline-block; vertical-align: middle; width: 100%;"
>
<a
target="_blank"
href="https://pikwizard.com/photo/digital-real-estate-analytics-with-charts-and-global-data-visualization/187a29dfb2dd44502880d9867f297c91/"
style="text-decoration: none; font-size: 10px; margin: 0;"
>
<img src="https://pikwizard.com/pw/medium/187a29dfb2dd44502880d9867f297c91.jpg" style="margin: 0; width: 100%;" alt="" />
<p style="font-size: 12px; margin: 0;">PikWizard</p>
</a>
</span>
</span>
Free (free of charge)
Free for personal and commercial use.
Author: People Creations
Similar Free Stock Images

Premium


Premium


Premium


Premium


Premium


Premium


Premium


Premium


Premium


Premium


Premium


Premium


Premium


Premium


Premium


Premium


Premium


Premium


Premium


Premium


Premium


Premium


Premium


Premium