
- Home >
- Stock Photos >
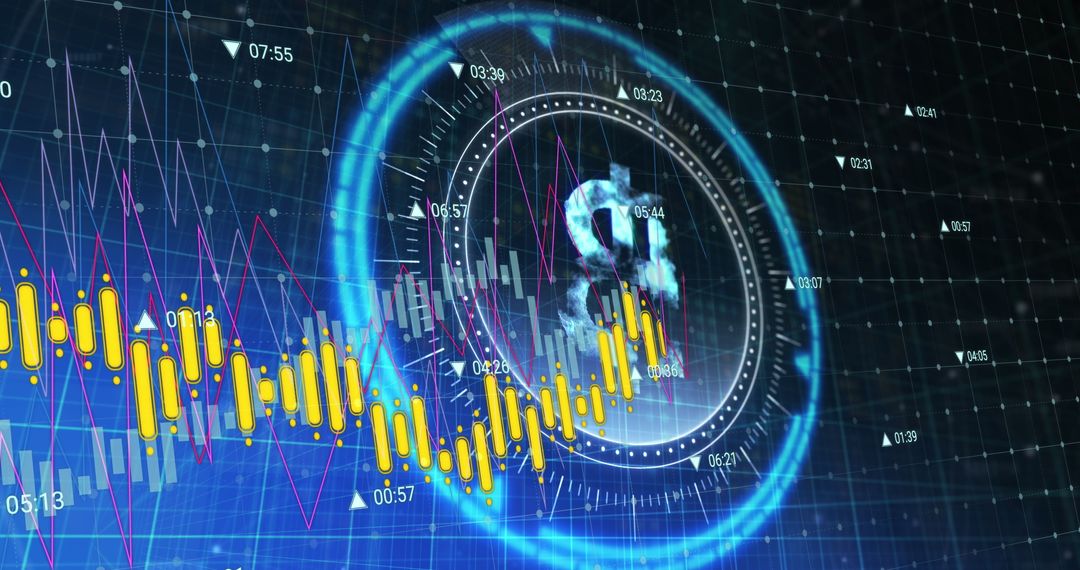
- Digital Stock Market Analysis and Financial Data Visualization
Digital Stock Market Analysis and Financial Data Visualization Image

This digital visualization features stock market data and charts with bright graphics against a dark background. It represents concepts of financial analysis, investment potential, and global trading trends. Ideal for use in financial reports, marketing for investment services, educational content on economics, and articles exploring digital advancements in finance.
Powered by 


4
downloads
downloads
Tags:
More
Credit Photo
If you would like to credit the Photo, here are some ways you can do so
Text Link
photo Link
<span class="text-link">
<span>
<a target="_blank" href=https://pikwizard.com/photo/digital-stock-market-analysis-and-financial-data-visualization/a1c6ccd808fd0ecf5d82d94223597920/>PikWizard</a>
</span>
</span>
<span class="image-link">
<span
style="margin: 0 0 20px 0; display: inline-block; vertical-align: middle; width: 100%;"
>
<a
target="_blank"
href="https://pikwizard.com/photo/digital-stock-market-analysis-and-financial-data-visualization/a1c6ccd808fd0ecf5d82d94223597920/"
style="text-decoration: none; font-size: 10px; margin: 0;"
>
<img src="https://pikwizard.com/pw/medium/a1c6ccd808fd0ecf5d82d94223597920.jpg" style="margin: 0; width: 100%;" alt="" />
<p style="font-size: 12px; margin: 0;">PikWizard</p>
</a>
</span>
</span>
Free (free of charge)
Free for personal and commercial use.
Author: Authentic Images
Similar Free Stock Images

Premium


Premium


Premium


Premium


Premium


Premium


Premium


Premium


Premium


Premium


Premium


Premium


Premium


Premium


Premium


Premium


Premium


Premium


Premium


Premium


Premium


Premium


Premium


Premium

