- Home >
- Stock Photos >
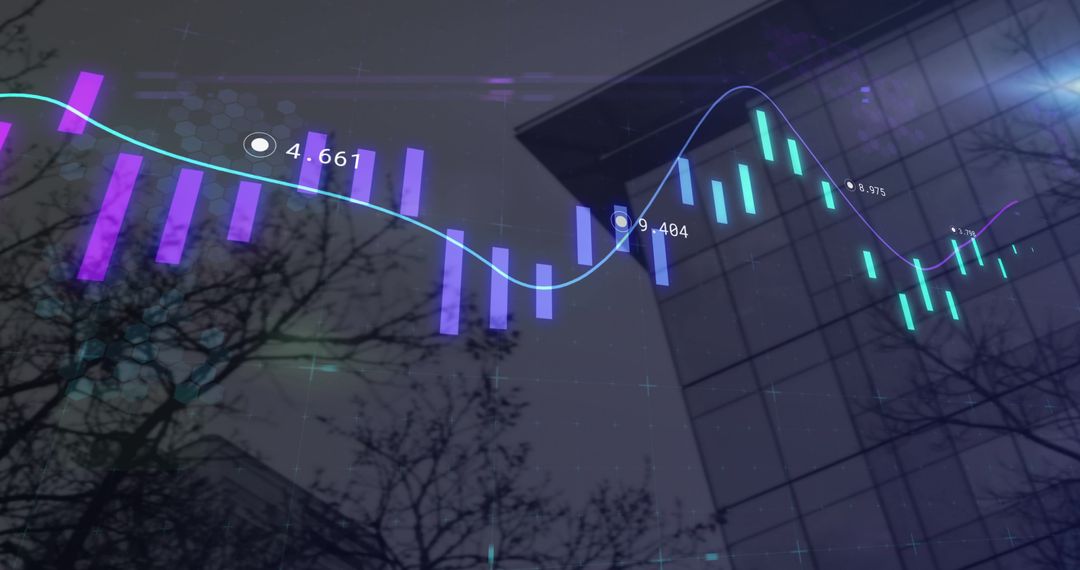
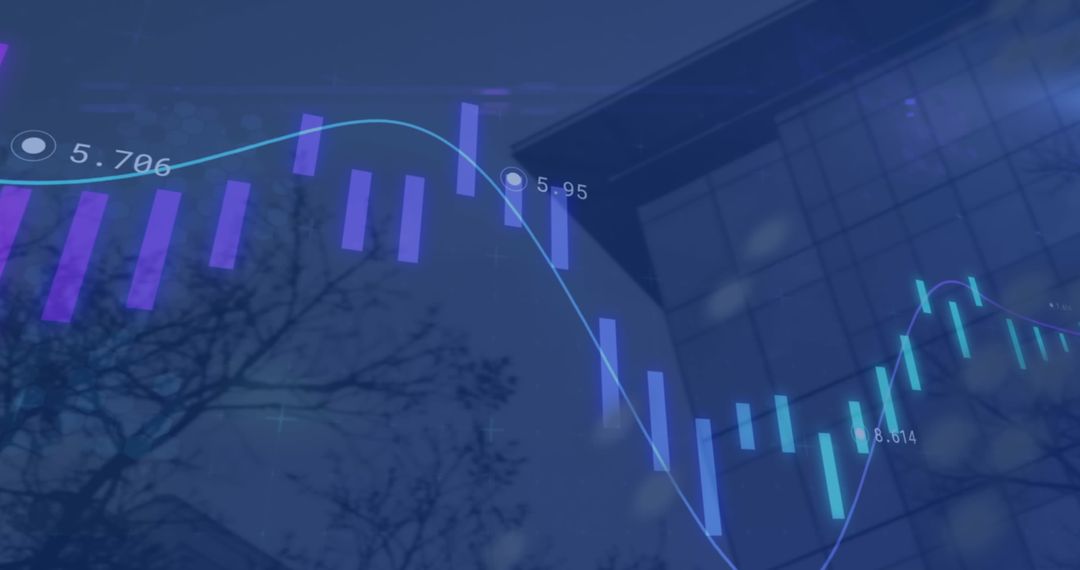
- Digital Stock Market Analysis with Futuristic Graph Overlay
Digital Stock Market Analysis with Futuristic Graph Overlay Image

Illustration of digital stock market analysis with a futuristic overlay of graphs and charts. This concept effectively combines elements of finance and technology, indicating market trends and financial data analysis on holographic screens against an urban backdrop. Useful for illustrating topics of financial investment, business solutions, trading technologies, and data-driven strategies.
Powered by 


2
downloads
downloads
Tags:
More
Credit Photo
If you would like to credit the Photo, here are some ways you can do so
Text Link
photo Link
<span class="text-link">
<span>
<a target="_blank" href=https://pikwizard.com/photo/digital-stock-market-analysis-with-futuristic-graph-overlay/1047e8fa2028bedbbb00fefcd4976137/>PikWizard</a>
</span>
</span>
<span class="image-link">
<span
style="margin: 0 0 20px 0; display: inline-block; vertical-align: middle; width: 100%;"
>
<a
target="_blank"
href="https://pikwizard.com/photo/digital-stock-market-analysis-with-futuristic-graph-overlay/1047e8fa2028bedbbb00fefcd4976137/"
style="text-decoration: none; font-size: 10px; margin: 0;"
>
<img src="https://pikwizard.com/pw/medium/1047e8fa2028bedbbb00fefcd4976137.jpg" style="margin: 0; width: 100%;" alt="" />
<p style="font-size: 12px; margin: 0;">PikWizard</p>
</a>
</span>
</span>
Free (free of charge)
Free for personal and commercial use.
Author: Awesome Content
Similar Free Stock Images

Premium


Premium


Premium


Premium


Premium


Premium


Premium


Premium


Premium


Premium


Premium


Premium


Premium


Premium


Premium


Premium


Premium


Premium


Premium


Premium


Premium


Premium


Premium


Premium