- Home >
- Stock Photos >
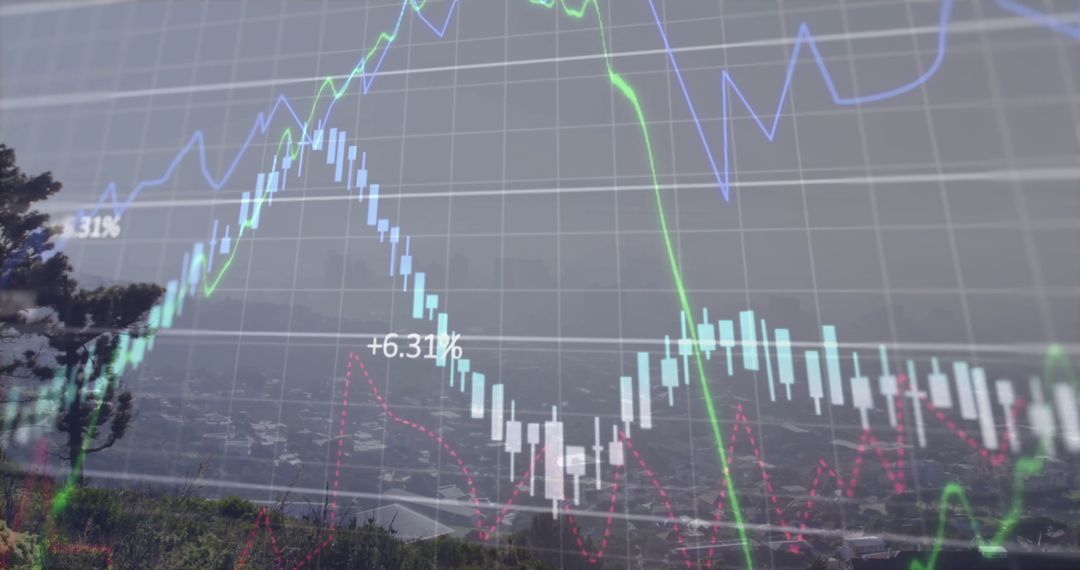
- Digital Stock Market Analytics Overlay on Warehouse Background
Digital Stock Market Analytics Overlay on Warehouse Background Image

Digitally generated interface displays stock market graphs overlaid on warehouse shelving, symbolizing integration of digital analytics with traditional storage. This concept focuses on merging logistical insights with financial technology for improved business operations. Useful for depicting ideas of innovation and digital transformation in commerce and industry.
Powered by  - Get 15% off with code: PIKWIZARD15


2
downloads
downloads
Tags:
More
Credit Photo
If you would like to credit the Photo, here are some ways you can do so
Text Link
photo Link
<span class="text-link">
<span>
<a target="_blank" href=https://pikwizard.com/photo/digital-stock-market-analytics-overlay-on-warehouse-background/b7c8cd30dd56a6d068183fcb5f4f926e/>PikWizard</a>
</span>
</span>
<span class="image-link">
<span
style="margin: 0 0 20px 0; display: inline-block; vertical-align: middle; width: 100%;"
>
<a
target="_blank"
href="https://pikwizard.com/photo/digital-stock-market-analytics-overlay-on-warehouse-background/b7c8cd30dd56a6d068183fcb5f4f926e/"
style="text-decoration: none; font-size: 10px; margin: 0;"
>
<img src="https://pikwizard.com/pw/medium/b7c8cd30dd56a6d068183fcb5f4f926e.jpg" style="margin: 0; width: 100%;" alt="" />
<p style="font-size: 12px; margin: 0;">PikWizard</p>
</a>
</span>
</span>
Free (free of charge)
Free for personal and commercial use.
Author: Creative Art
Similar Free Stock Images

Premium


Premium


Premium


Premium


Premium


Premium


Premium


Premium


Premium


Premium


Premium


Premium


Premium


Premium


Premium


Premium


Premium


Premium


Premium


Premium


Premium


Premium


Premium


Premium