
- Home >
- Stock Photos >
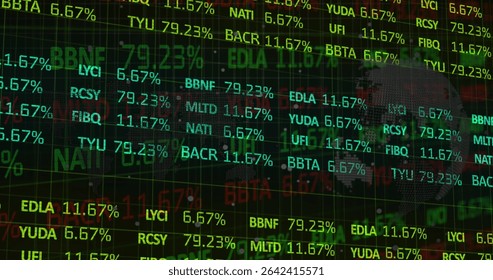
- Digital Stock Market Data Display with Graphs and Tickers
Digital Stock Market Data Display with Graphs and Tickers Image
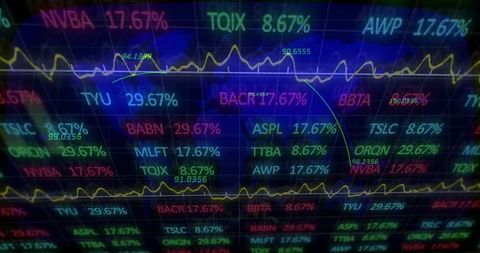
Shows a futuristic digital display of stock market data with colorful line graphs and dynamic ticker symbols trending across the screen. Perfect for illustrating financial analytics, investment monitoring, and trading platforms. Can be used in financial reports, articles, or presentations on stock analysis and market trends.
Powered by  - Get 15% off with code: PIKWIZARD15


0
downloads
downloads
Tags:
More
Credit Photo
If you would like to credit the Photo, here are some ways you can do so
Text Link
photo Link
<span class="text-link">
<span>
<a target="_blank" href=https://pikwizard.com/photo/digital-stock-market-data-display-with-graphs-and-tickers/52bdafaf09c2836c9a73f0e8646a228e/>PikWizard</a>
</span>
</span>
<span class="image-link">
<span
style="margin: 0 0 20px 0; display: inline-block; vertical-align: middle; width: 100%;"
>
<a
target="_blank"
href="https://pikwizard.com/photo/digital-stock-market-data-display-with-graphs-and-tickers/52bdafaf09c2836c9a73f0e8646a228e/"
style="text-decoration: none; font-size: 10px; margin: 0;"
>
<img src="https://pikwizard.com/pw/medium/52bdafaf09c2836c9a73f0e8646a228e.jpg" style="margin: 0; width: 100%;" alt="" />
<p style="font-size: 12px; margin: 0;">PikWizard</p>
</a>
</span>
</span>
Free (free of charge)
Free for personal and commercial use.
Author: Authentic Images