- Home >
- Stock Photos >
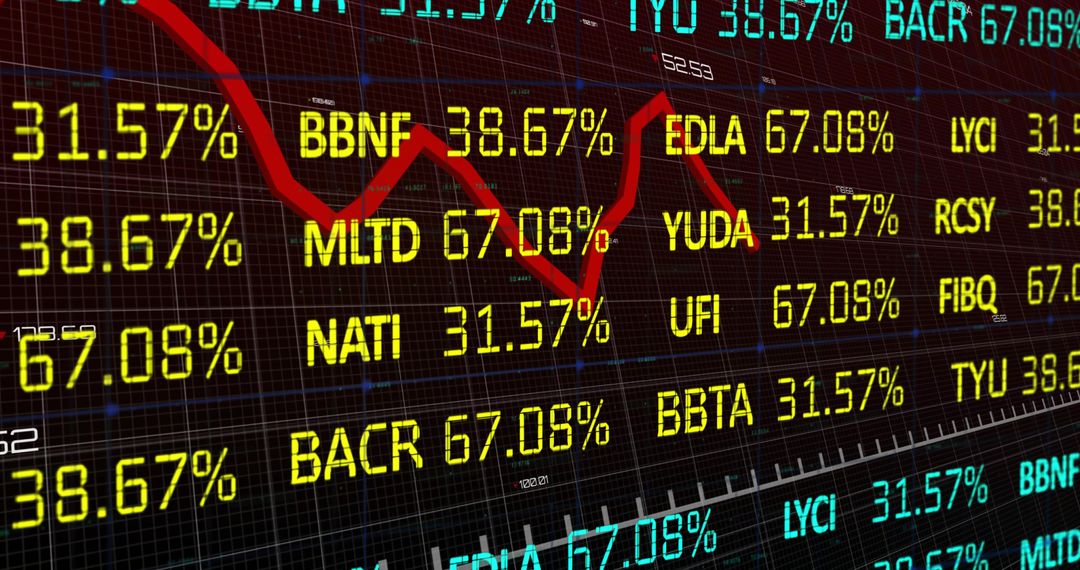
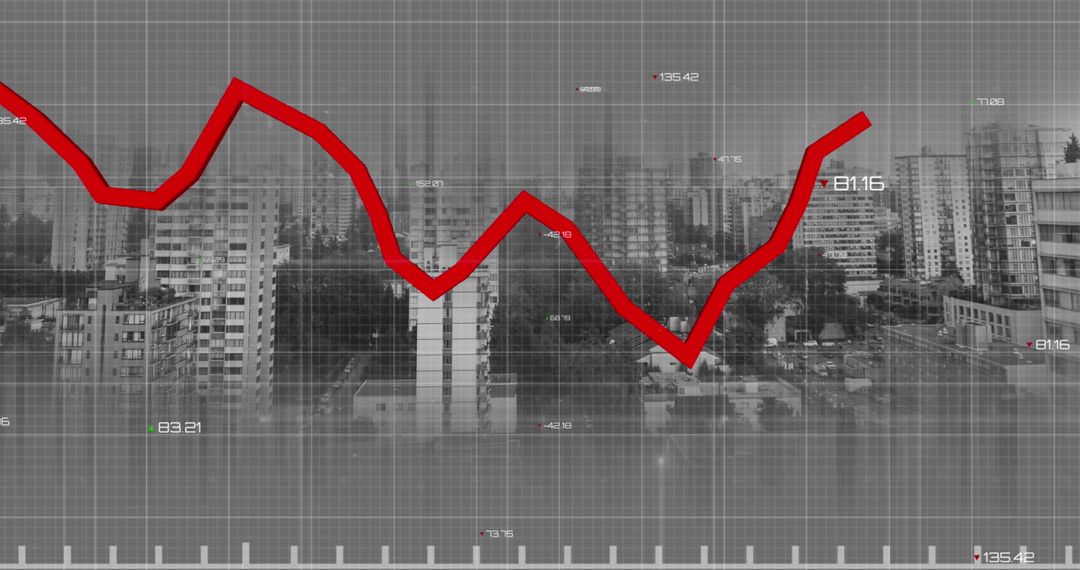
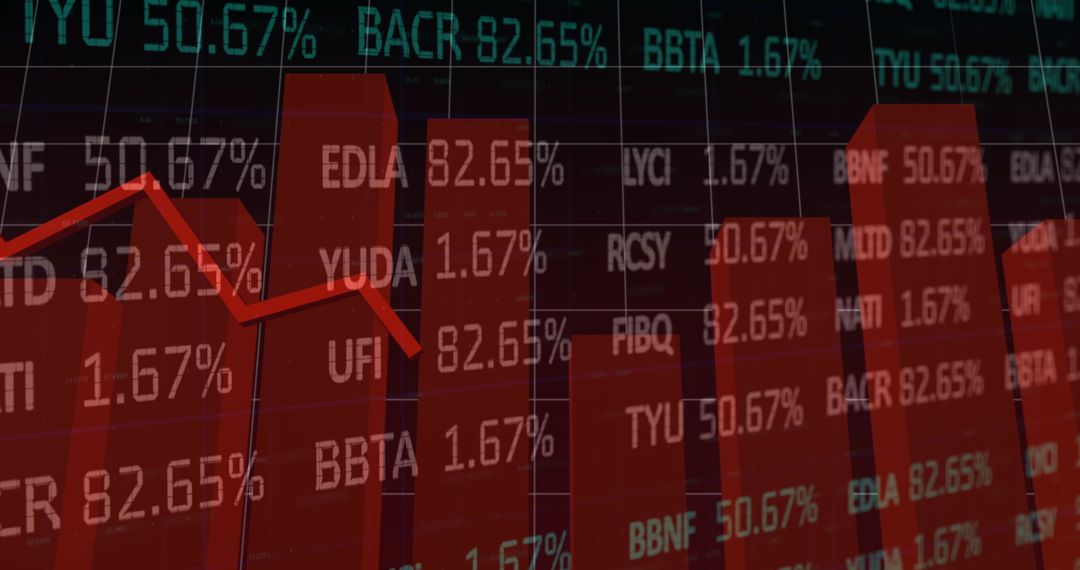
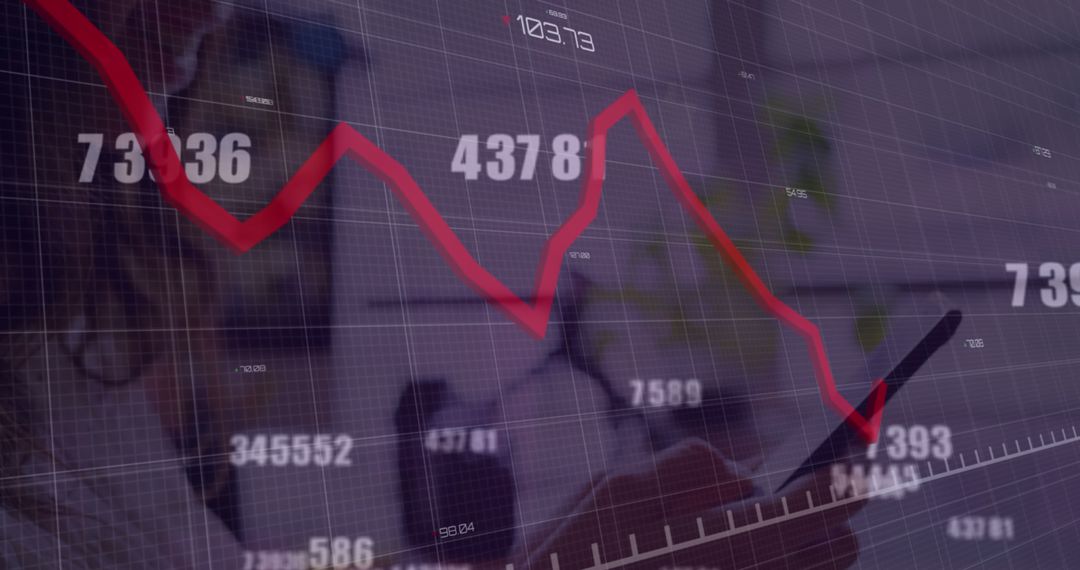
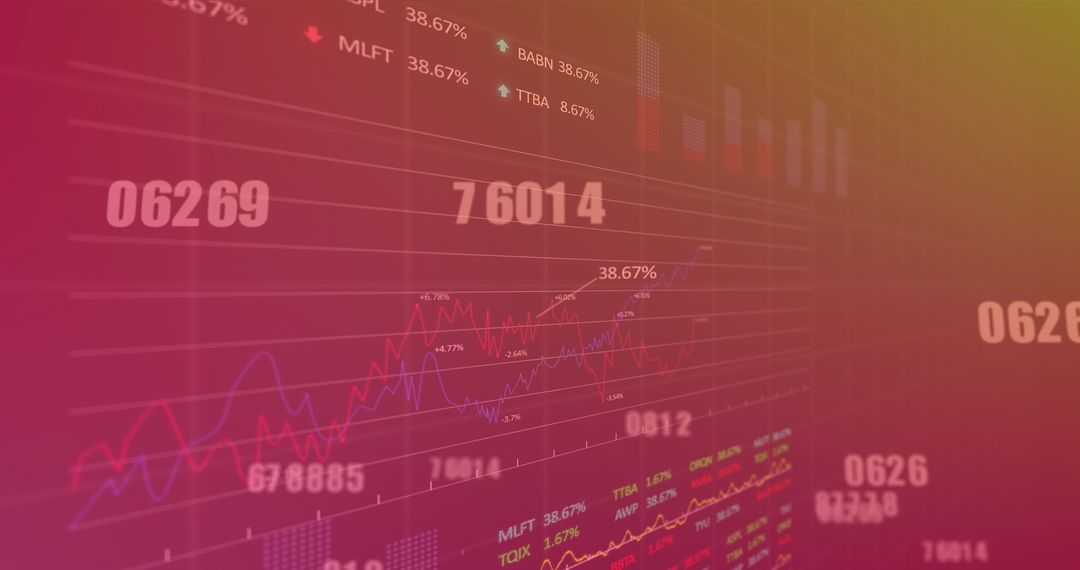
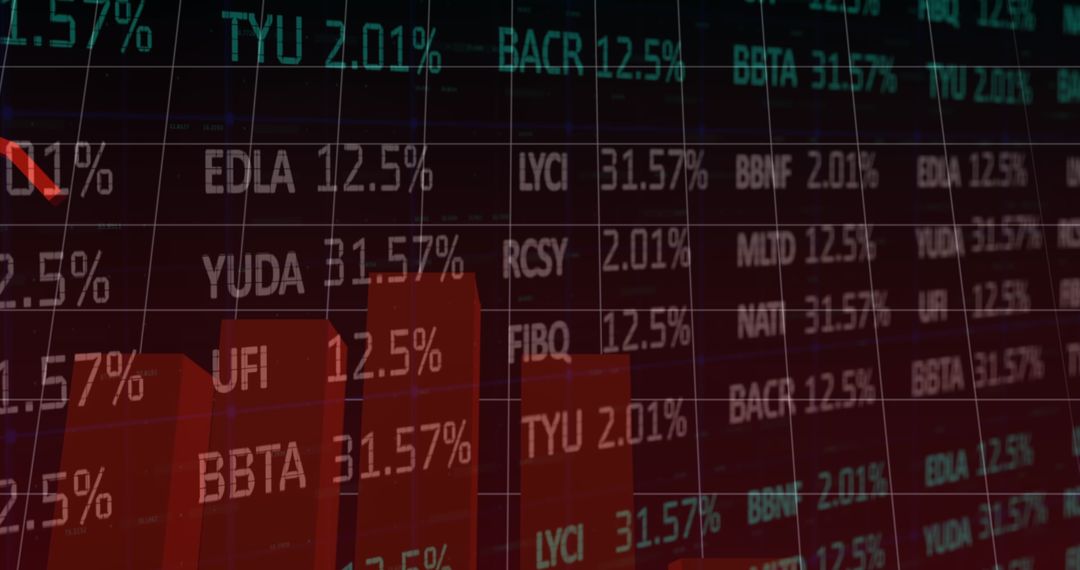
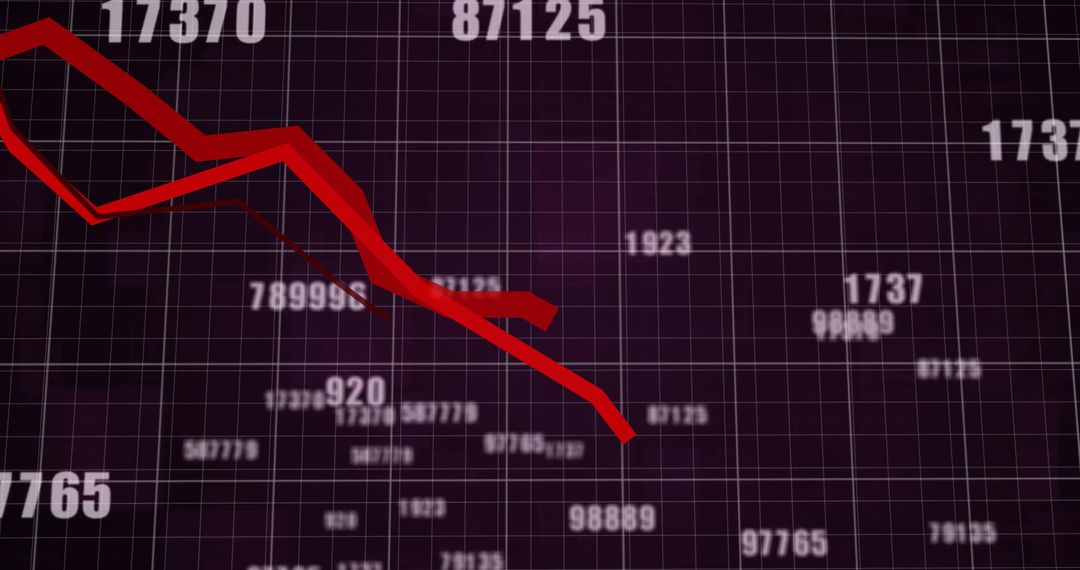
- Digital Stock Market Data on Red Background
Digital Stock Market Data on Red Background Image

The image illustrates digital stock market data on a dynamic red background, featuring numerical values and timelines commonly associated with financial trends and analytics. It captures the essence of global financial movements and data processing in modern trading environments. Ideal for use in financial reports, digital presentations, educational materials on economics, and websites focused on finance or technology.
Powered by 


2
downloads
downloads
Tags:
More
Credit Photo
If you would like to credit the Photo, here are some ways you can do so
Text Link
photo Link
<span class="text-link">
<span>
<a target="_blank" href=https://pikwizard.com/photo/digital-stock-market-data-on-red-background/aeb7287f800aafa97f2a013ce14c6b48/>PikWizard</a>
</span>
</span>
<span class="image-link">
<span
style="margin: 0 0 20px 0; display: inline-block; vertical-align: middle; width: 100%;"
>
<a
target="_blank"
href="https://pikwizard.com/photo/digital-stock-market-data-on-red-background/aeb7287f800aafa97f2a013ce14c6b48/"
style="text-decoration: none; font-size: 10px; margin: 0;"
>
<img src="https://pikwizard.com/pw/medium/aeb7287f800aafa97f2a013ce14c6b48.jpg" style="margin: 0; width: 100%;" alt="" />
<p style="font-size: 12px; margin: 0;">PikWizard</p>
</a>
</span>
</span>
Free (free of charge)
Free for personal and commercial use.
Author: People Creations
Similar Free Stock Images

Premium


Premium


Premium


Premium


Premium


Premium


Premium


Premium


Premium


Premium


Premium


Premium


Premium


Premium


Premium


Premium


Premium


Premium


Premium


Premium


Premium


Premium


Premium


Premium