- Home >
- Stock Photos >
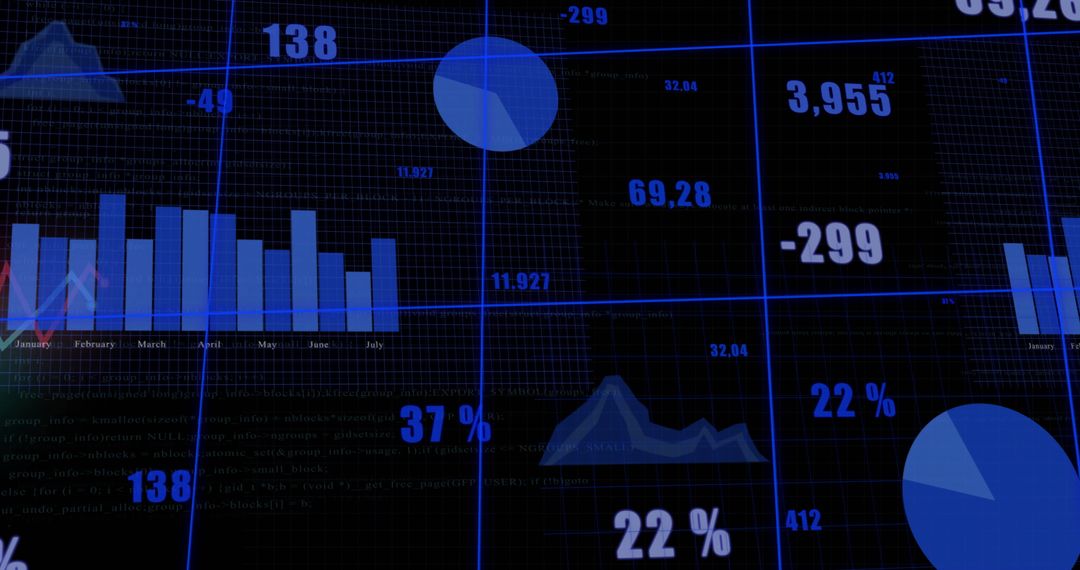
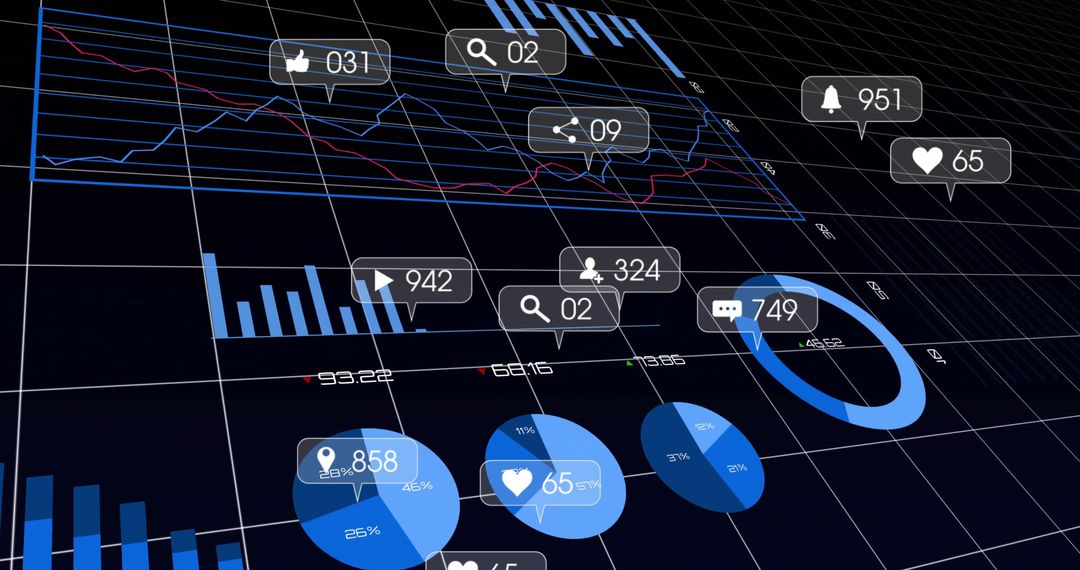
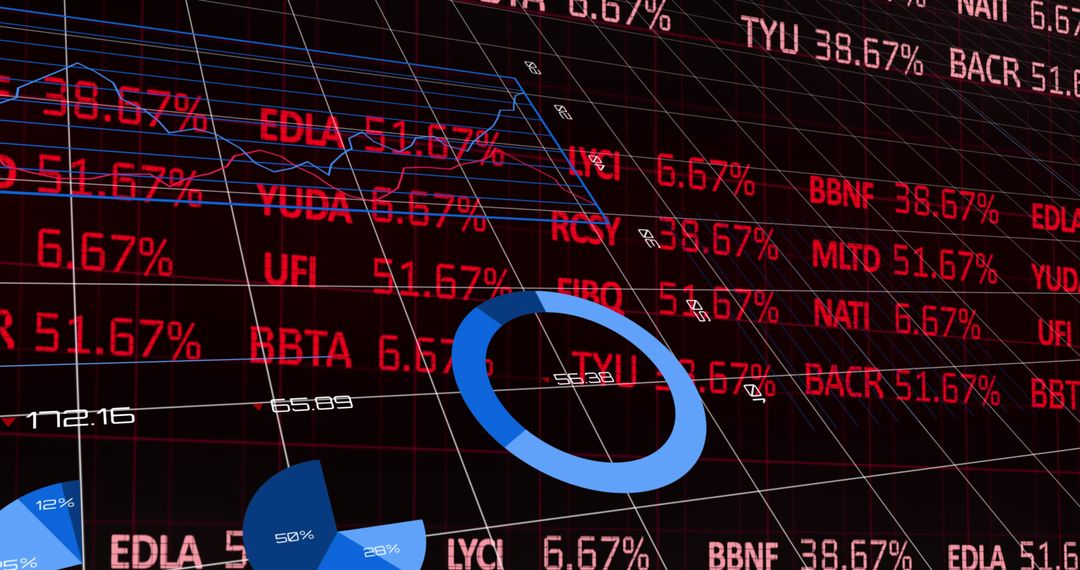
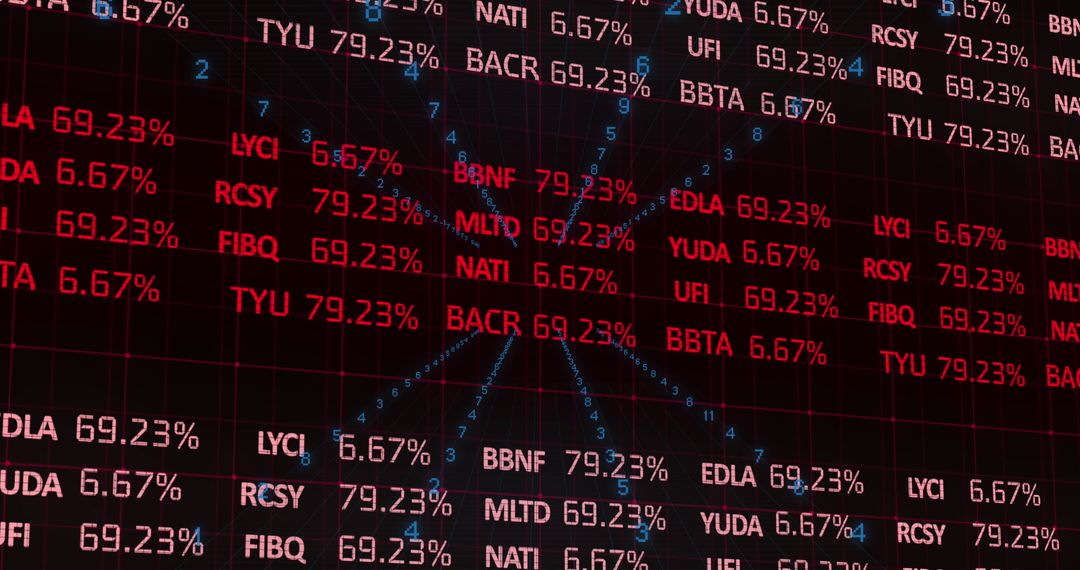
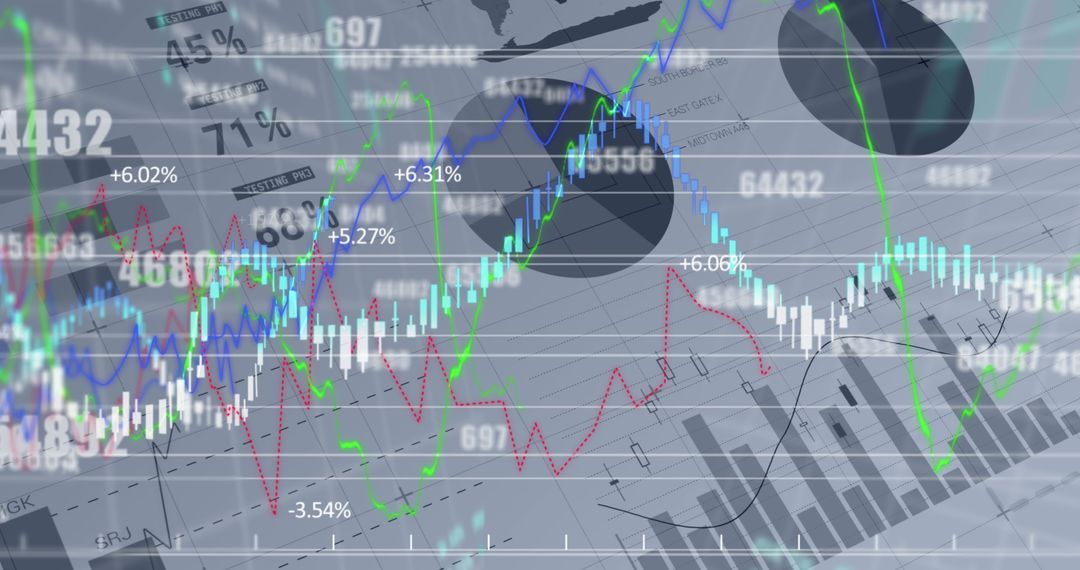
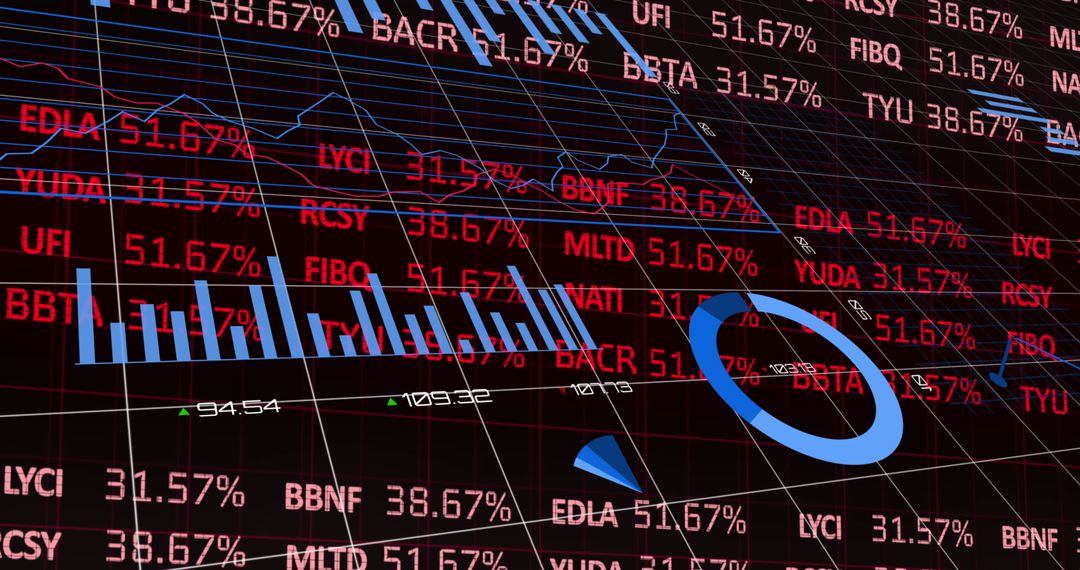
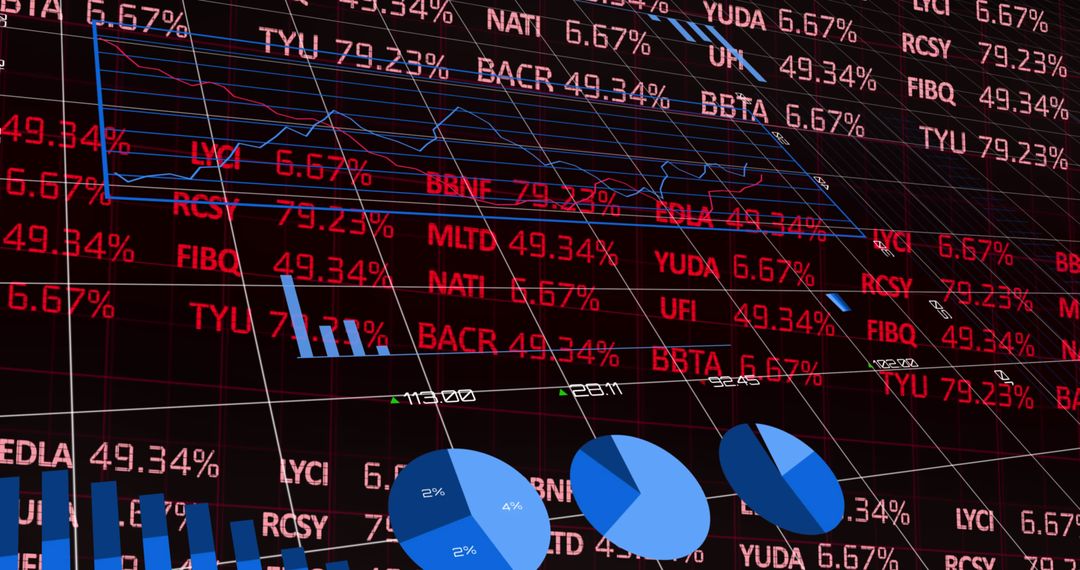
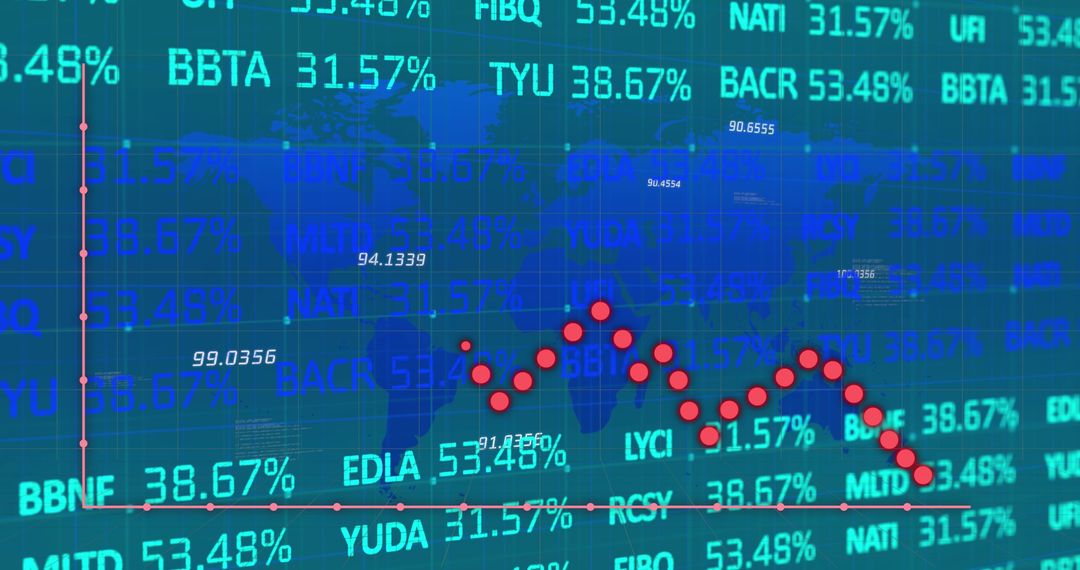
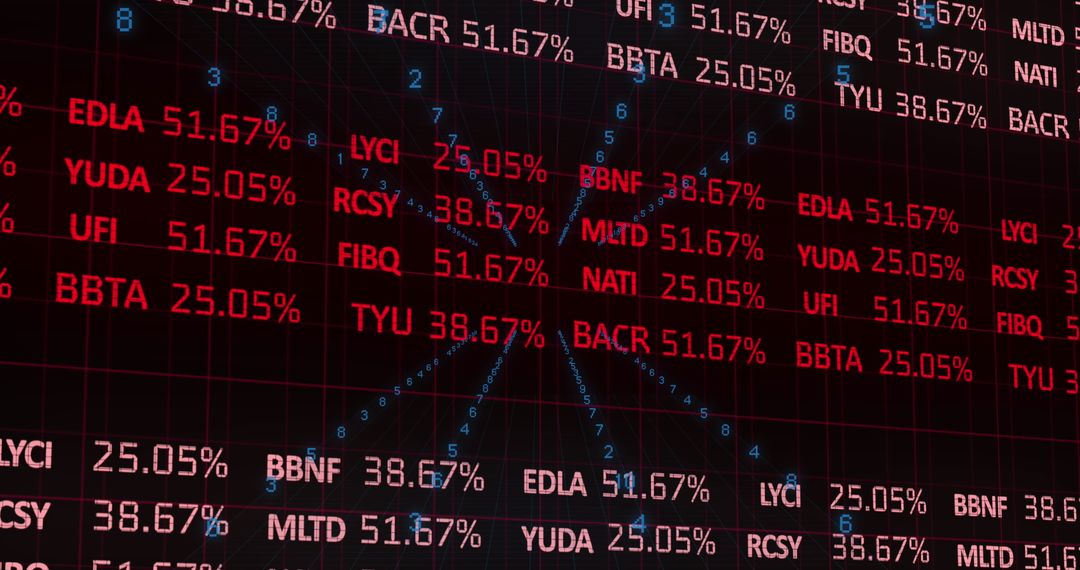
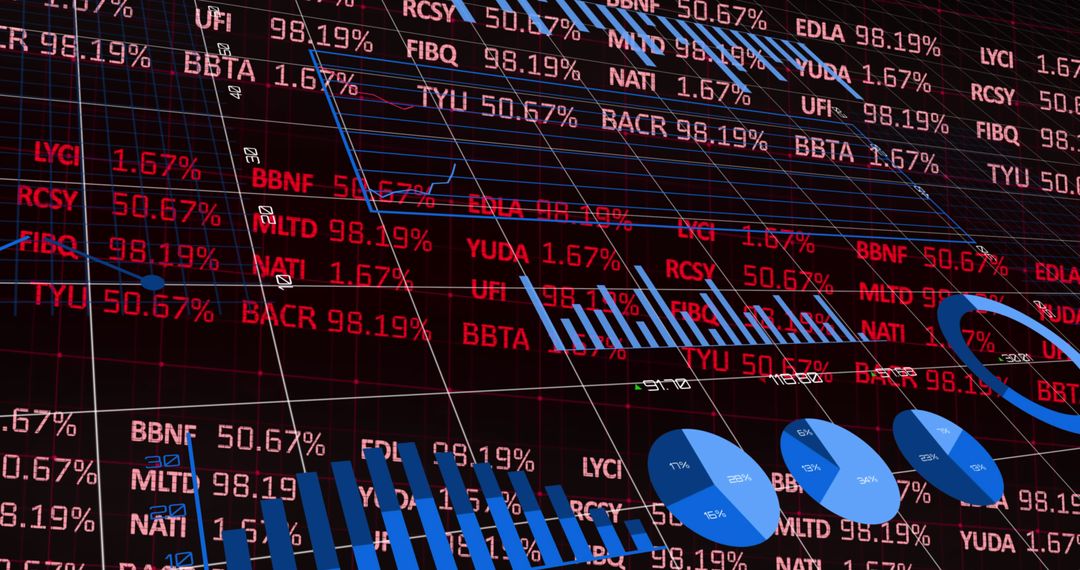
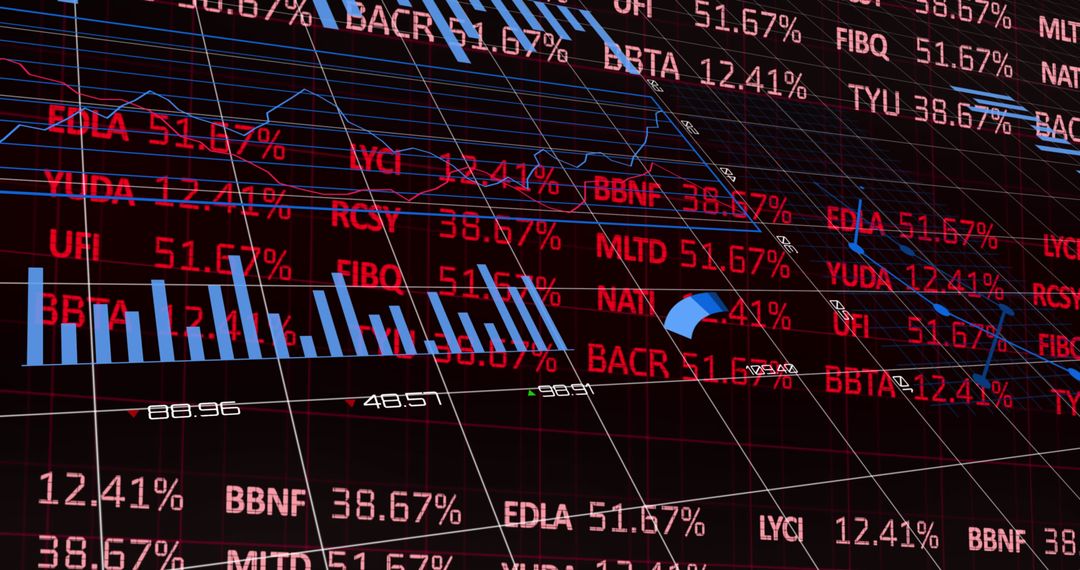
- Digital Stock Market Data with Graphs and Percentages
Digital Stock Market Data with Graphs and Percentages Image
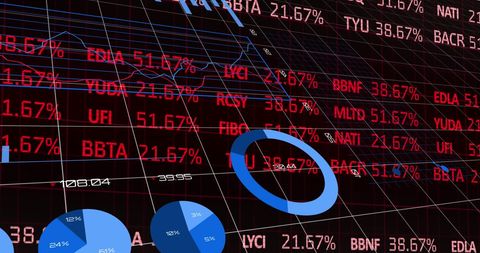
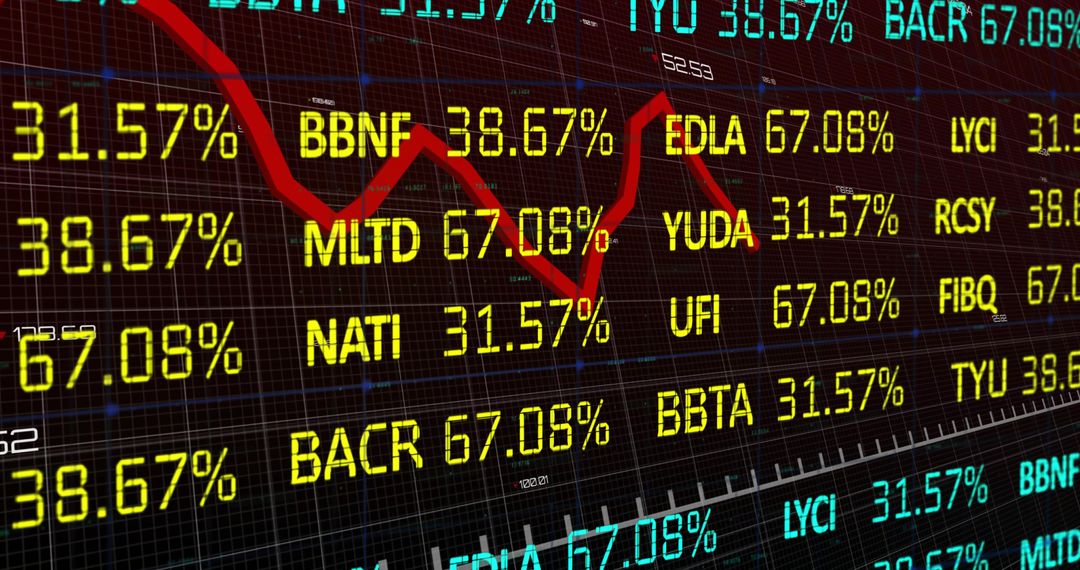
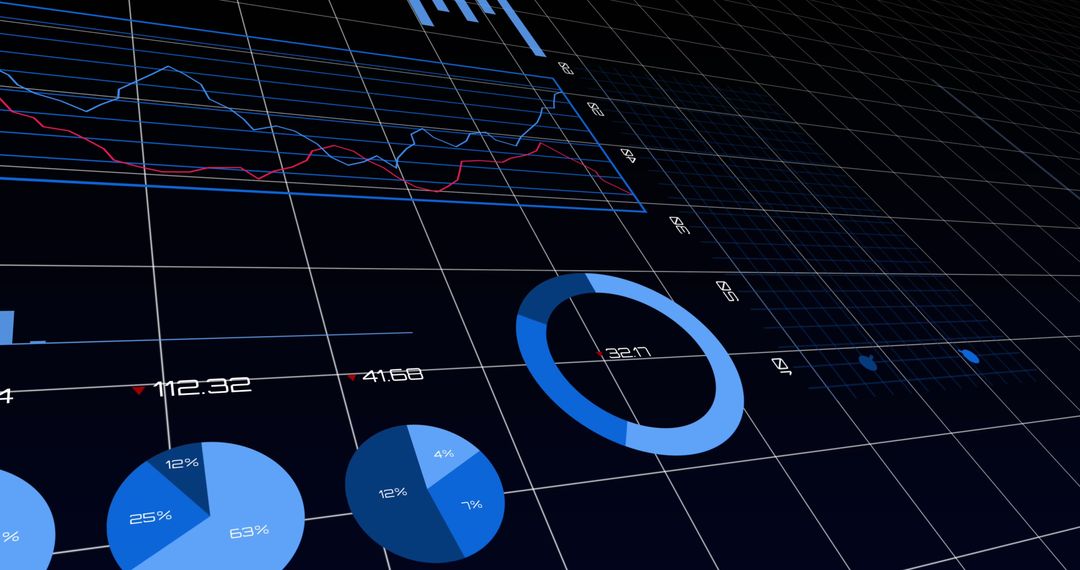
This visually striking representation showcases stock market data with bright red percentages indicating market changes, set against a dark digital background. It features blue graphs and pie charts representing various financial metrics. Ideal for use in articles, presentations, or websites related to finance, global markets, economics, or data analysis.
Powered by  - Get 15% off with code: PIKWIZARD15


2
downloads
downloads
Tags:
More
Credit Photo
If you would like to credit the Photo, here are some ways you can do so
Text Link
photo Link
<span class="text-link">
<span>
<a target="_blank" href=https://pikwizard.com/photo/digital-stock-market-data-with-graphs-and-percentages/e032ee4a1136396999e960761d6286e3/>PikWizard</a>
</span>
</span>
<span class="image-link">
<span
style="margin: 0 0 20px 0; display: inline-block; vertical-align: middle; width: 100%;"
>
<a
target="_blank"
href="https://pikwizard.com/photo/digital-stock-market-data-with-graphs-and-percentages/e032ee4a1136396999e960761d6286e3/"
style="text-decoration: none; font-size: 10px; margin: 0;"
>
<img src="https://pikwizard.com/pw/medium/e032ee4a1136396999e960761d6286e3.jpg" style="margin: 0; width: 100%;" alt="" />
<p style="font-size: 12px; margin: 0;">PikWizard</p>
</a>
</span>
</span>
Free (free of charge)
Free for personal and commercial use.
Author: Creative Art
Similar Free Stock Images

Premium


Premium


Premium


Premium


Premium


Premium


Premium


Premium


Premium


Premium


Premium


Premium


Premium


Premium


Premium


Premium


Premium


Premium


Premium


Premium

Premium


Premium


Premium


Premium