- Home >
- Stock Photos >
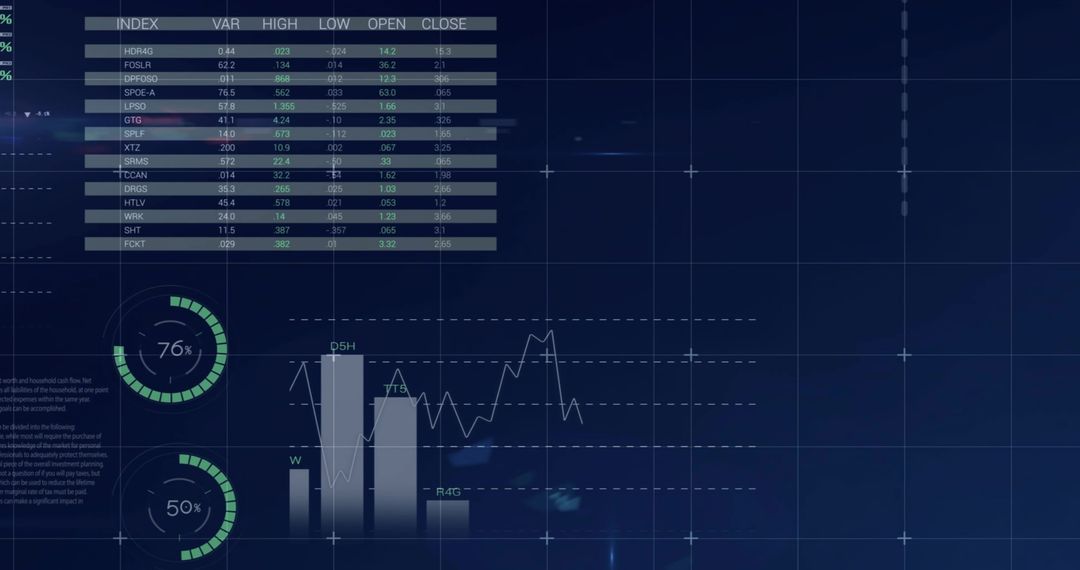
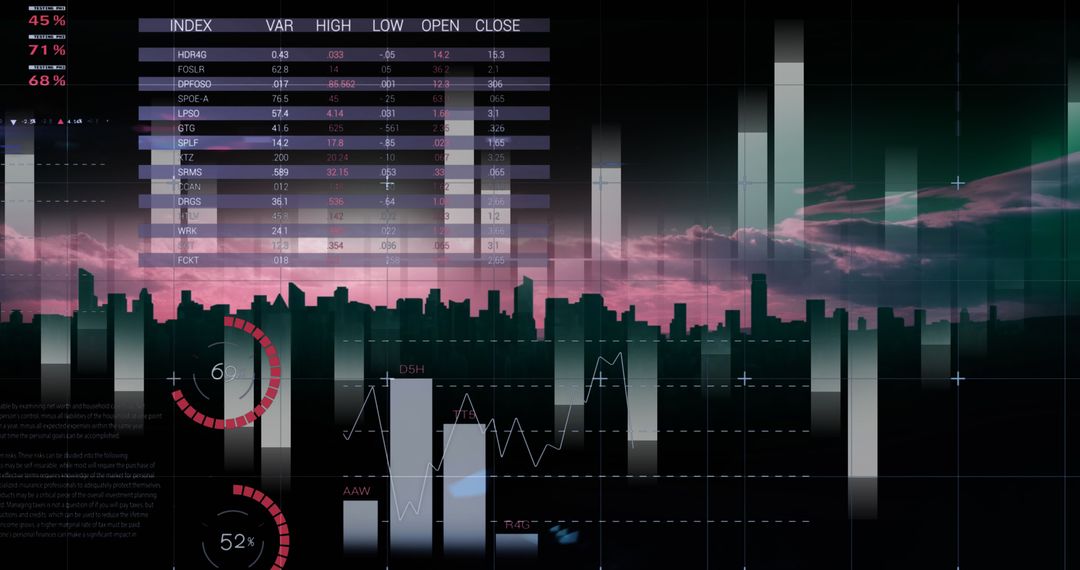
- Digital Stock Market Data with Graphs and Statistics
Digital Stock Market Data with Graphs and Statistics Image

Image shows a futuristic digital display of the stock market, featuring dynamic graphs and numerical data. Ideal for illustrating concepts related to global business trends, financial analysis, and stock trading. Useful for financial articles, website backgrounds, or presentations dealing with economic forecasts and market behavior.
Powered by 


2
downloads
downloads
Tags:
More
Credit Photo
If you would like to credit the Photo, here are some ways you can do so
Text Link
photo Link
<span class="text-link">
<span>
<a target="_blank" href=https://pikwizard.com/photo/digital-stock-market-data-with-graphs-and-statistics/21a996ff966dd4ef82d134d834213688/>PikWizard</a>
</span>
</span>
<span class="image-link">
<span
style="margin: 0 0 20px 0; display: inline-block; vertical-align: middle; width: 100%;"
>
<a
target="_blank"
href="https://pikwizard.com/photo/digital-stock-market-data-with-graphs-and-statistics/21a996ff966dd4ef82d134d834213688/"
style="text-decoration: none; font-size: 10px; margin: 0;"
>
<img src="https://pikwizard.com/pw/medium/21a996ff966dd4ef82d134d834213688.jpg" style="margin: 0; width: 100%;" alt="" />
<p style="font-size: 12px; margin: 0;">PikWizard</p>
</a>
</span>
</span>
Free (free of charge)
Free for personal and commercial use.
Author: People Creations
Similar Free Stock Images

Premium


Premium


Premium


Premium


Premium


Premium


Premium


Premium


Premium


Premium


Premium


Premium


Premium


Premium


Premium


Premium


Premium


Premium


Premium


Premium


Premium


Premium


Premium


Premium