
- Home >
- Stock Photos >
- Digital Trading Dashboard with Line and Bar Charts
Digital Trading Dashboard with Line and Bar Charts Image
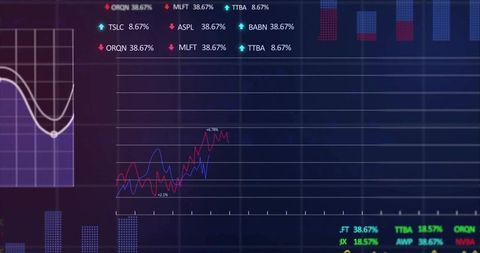
Image illustrates a trading interface with vibrant line and bar charts against a grid-style background. Stock ticker symbols and numerical percentage readouts show financial data analytics, offering insights into market trends. Useful for presentations on finance, stock trading platforms, modern financial analytics tools, or tutorials on utilizing digital interfaces for investments.
Powered by 


0
downloads
downloads
Tags:
More
Credit Photo
If you would like to credit the Photo, here are some ways you can do so
Text Link
photo Link
<span class="text-link">
<span>
<a target="_blank" href=https://pikwizard.com/photo/digital-trading-dashboard-with-line-and-bar-charts/9060b23719ffdbf53e5f7b9f94b9fc52/>PikWizard</a>
</span>
</span>
<span class="image-link">
<span
style="margin: 0 0 20px 0; display: inline-block; vertical-align: middle; width: 100%;"
>
<a
target="_blank"
href="https://pikwizard.com/photo/digital-trading-dashboard-with-line-and-bar-charts/9060b23719ffdbf53e5f7b9f94b9fc52/"
style="text-decoration: none; font-size: 10px; margin: 0;"
>
<img src="https://pikwizard.com/pw/medium/9060b23719ffdbf53e5f7b9f94b9fc52.jpg" style="margin: 0; width: 100%;" alt="" />
<p style="font-size: 12px; margin: 0;">PikWizard</p>
</a>
</span>
</span>
Free (free of charge)
Free for personal and commercial use.
Author: People Creations