- Home >
- Stock Photos >
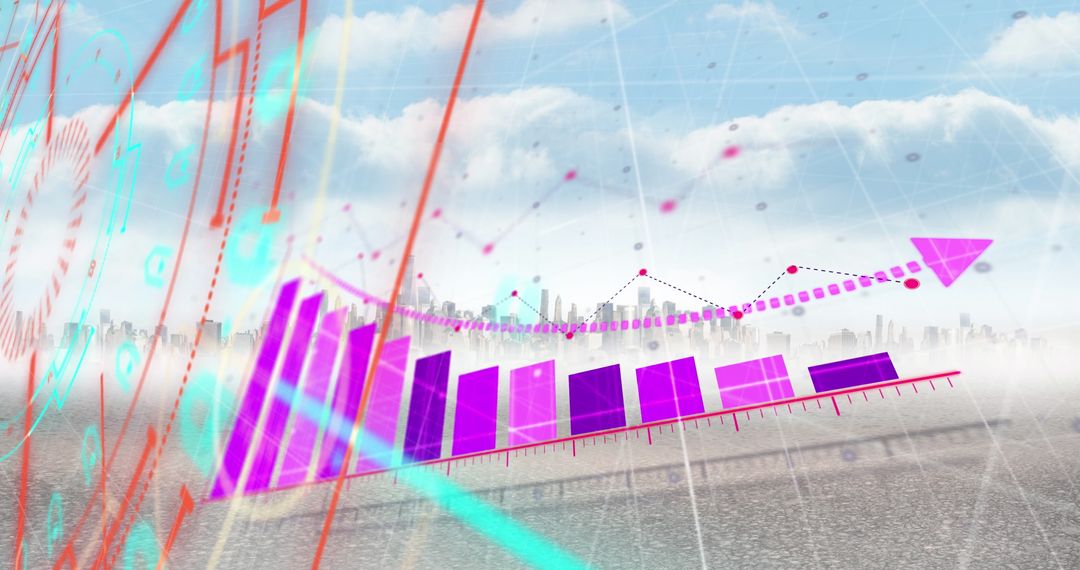
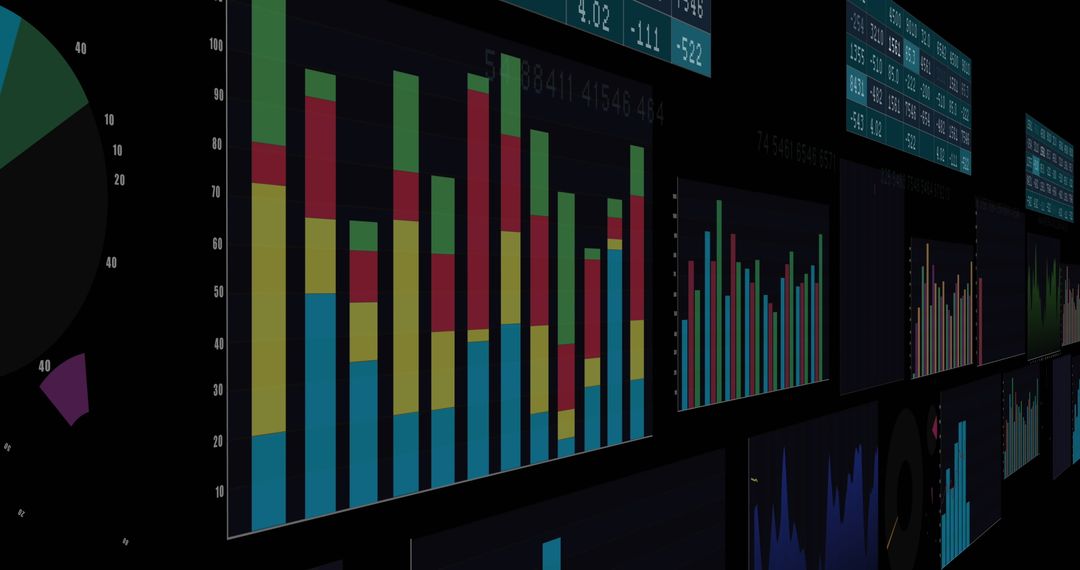
- Displaying 3D stacked bar analytics dashboard with multicolor column charts and grid axes
Displaying 3D stacked bar analytics dashboard with multicolor column charts and grid axes Image

Displaying 3D stacked bar and column charts across floating panels with grid axes, color bands, and depth perspective. Composition suggesting complex data analysis and financial reporting for business intelligence projects. Demonstrating analytics dashboard layout suitable for websites, presentations, reports, marketing materials, training, blogs, social media promoting analytics tools or fintech products. Working well as hero banner, slide background, case study header, white paper cover, or product page visual where conveying data-driven decisions, big data, or dashboard UI concepts. Layered transparency and muted palette allowing overlay text or icons without losing data context.
Powered by  - Get 15% off with code: PIKWIZARD15


0
downloads
downloads
Tags:
More
Credit Photo
If you would like to credit the Photo, here are some ways you can do so
Text Link
photo Link
<span class="text-link">
<span>
<a target="_blank" href=https://pikwizard.com/photo/displaying-3d-stacked-bar-analytics-dashboard-with-multicolor-column-charts-and-grid-axes/d1f804c5bcb14f6c919fc04c27fbd5ff/>PikWizard</a>
</span>
</span>
<span class="image-link">
<span
style="margin: 0 0 20px 0; display: inline-block; vertical-align: middle; width: 100%;"
>
<a
target="_blank"
href="https://pikwizard.com/photo/displaying-3d-stacked-bar-analytics-dashboard-with-multicolor-column-charts-and-grid-axes/d1f804c5bcb14f6c919fc04c27fbd5ff/"
style="text-decoration: none; font-size: 10px; margin: 0;"
>
<img src="https://pikwizard.com/pw/medium/d1f804c5bcb14f6c919fc04c27fbd5ff.jpg" style="margin: 0; width: 100%;" alt="" />
<p style="font-size: 12px; margin: 0;">PikWizard</p>
</a>
</span>
</span>
Free (free of charge)
Free for personal and commercial use.
Author: Authentic Images
Similar Free Stock Images

Premium


Premium


Premium


Premium


Premium


Premium


Premium


Premium


Premium


Premium


Premium


Premium


Premium


Premium


Premium


Premium


Premium


Premium


Premium


Premium


Premium


Premium


Premium


Premium