- Home >
- Stock Photos >
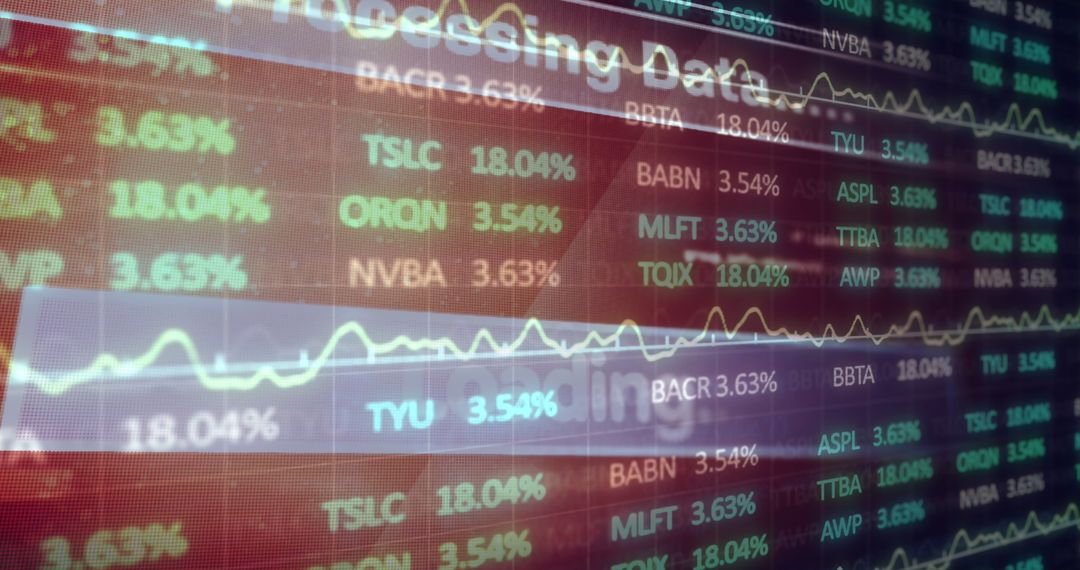
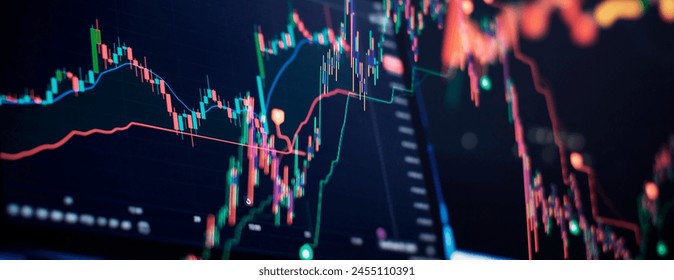
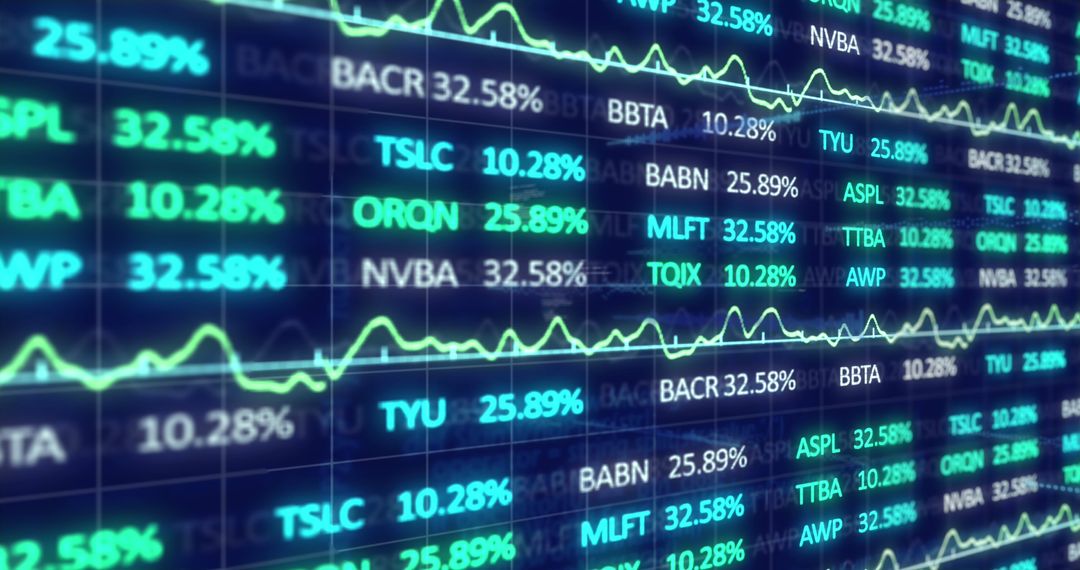
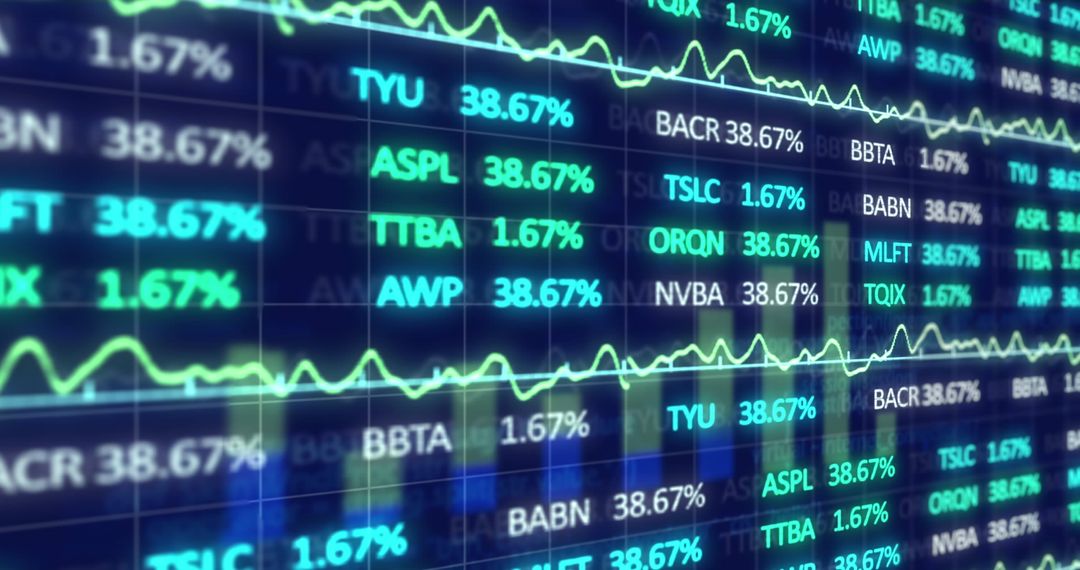
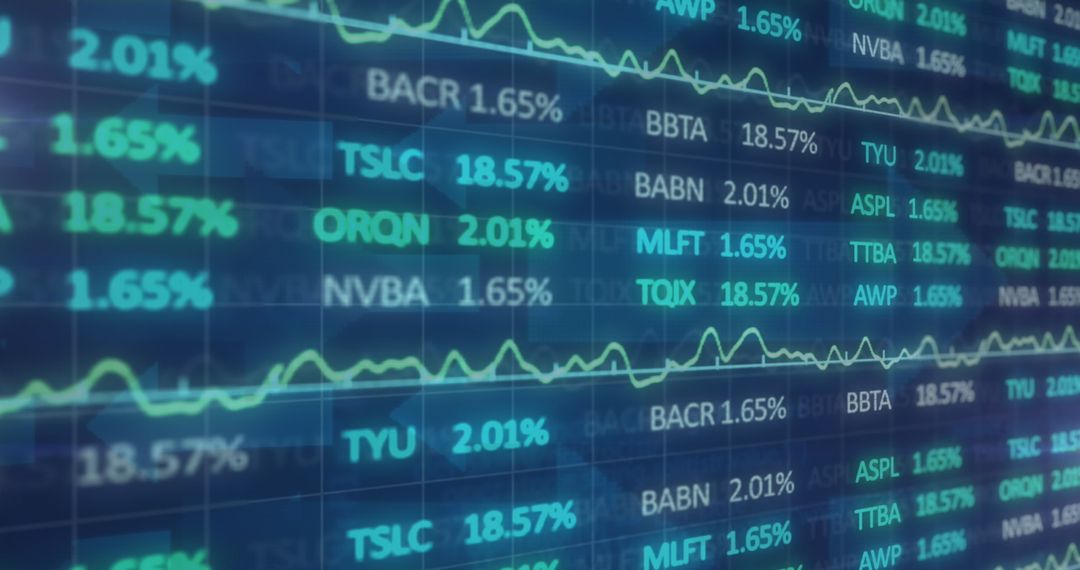
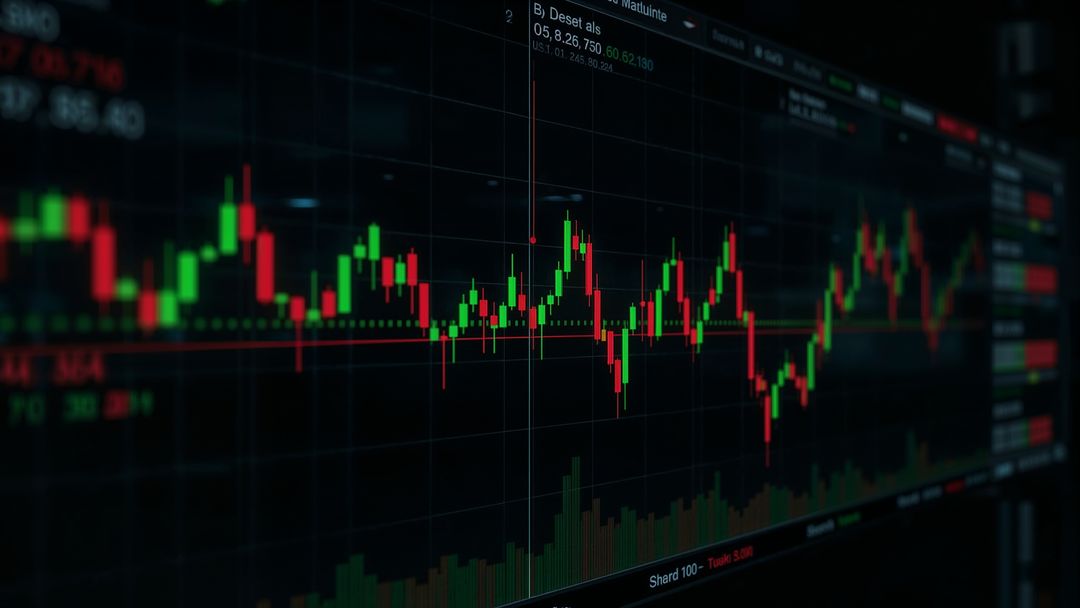
- Displaying Candlestick Chart Tracking Market Volatility with Volume Histogram and Tickers
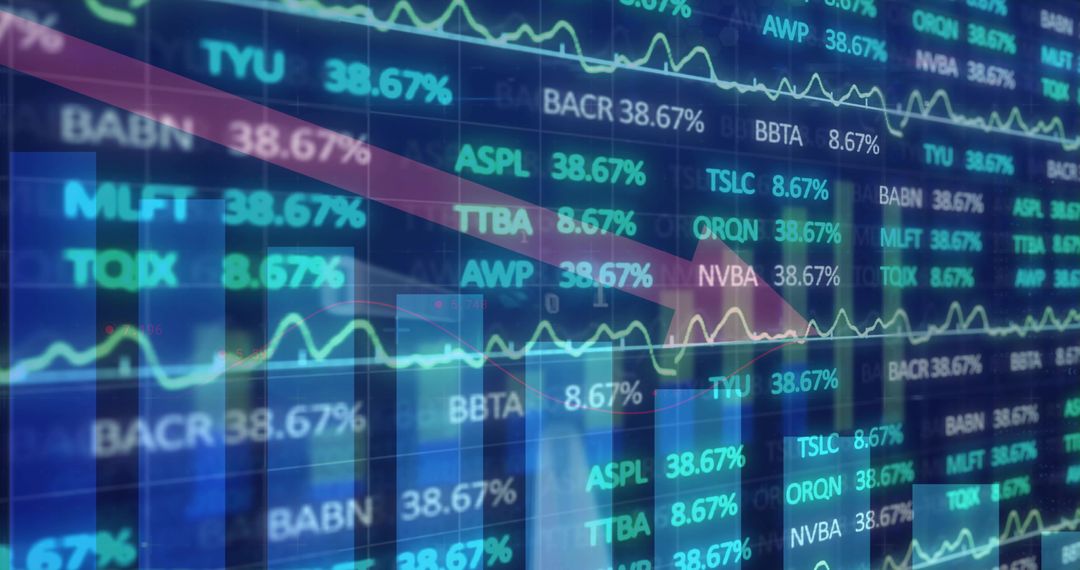
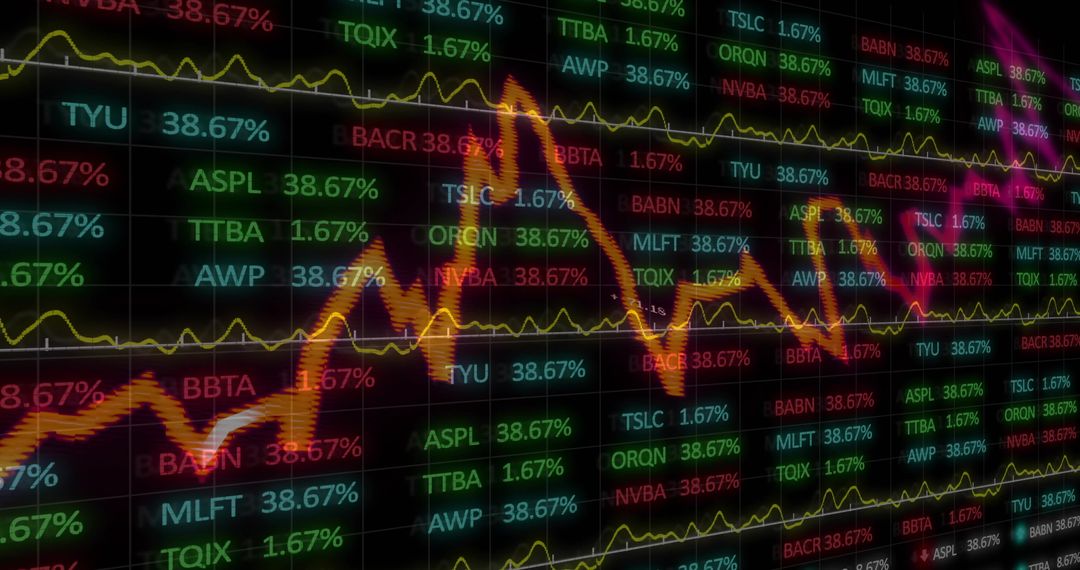
Displaying Candlestick Chart Tracking Market Volatility with Volume Histogram and Tickers Image

AI Generated Image. Illustrating candlestick trading activity on dark interface, showing red and green candles, gridlines, volume histogram and live tickers. Fitting use in financial articles, trading platform landing pages, investment reports, fintech presentations and data analytics dashboards. Serving as hero visual for market volatility stories, background for webinars about technical analysis, thumbnail for trading tutorials and header for brokerage websites. Offering modern high-tech mood with strong contrast for on-screen text overlays. Recommending cropping for widescreen banners and applying subtle blur to enhance focus on key chart area. Alt text suggestion: 'Candlestick chart and volume histogram showing market volatility and trading tickers.'
Powered by  - Get 15% off with code: PIKWIZARD15


0
downloads
downloads
Tags:
More
Credit Photo
If you would like to credit the Photo, here are some ways you can do so
Text Link
photo Link
<span class="text-link">
<span>
<a target="_blank" href=https://pikwizard.com/photo/displaying-candlestick-chart-tracking-market-volatility-with-volume-histogram-and-tickers/0387eb4e86edcaf10599a0e8ab82e30b/>PikWizard</a>
</span>
</span>
<span class="image-link">
<span
style="margin: 0 0 20px 0; display: inline-block; vertical-align: middle; width: 100%;"
>
<a
target="_blank"
href="https://pikwizard.com/photo/displaying-candlestick-chart-tracking-market-volatility-with-volume-histogram-and-tickers/0387eb4e86edcaf10599a0e8ab82e30b/"
style="text-decoration: none; font-size: 10px; margin: 0;"
>
<img src="https://pikwizard.com/pw/medium/0387eb4e86edcaf10599a0e8ab82e30b.jpg" style="margin: 0; width: 100%;" alt="" />
<p style="font-size: 12px; margin: 0;">PikWizard</p>
</a>
</span>
</span>
Free (free of charge)
Free for personal and commercial use.
Author: AI Creator
Similar Free Stock Images

Premium


Premium


Premium


Premium


Premium


Premium


Premium


Premium


Premium


Premium


Premium


Premium


Premium


Premium


Premium


Premium


Premium


Premium


Premium


Premium


Premium


Premium


Premium


Premium