- Home >
- Stock Photos >
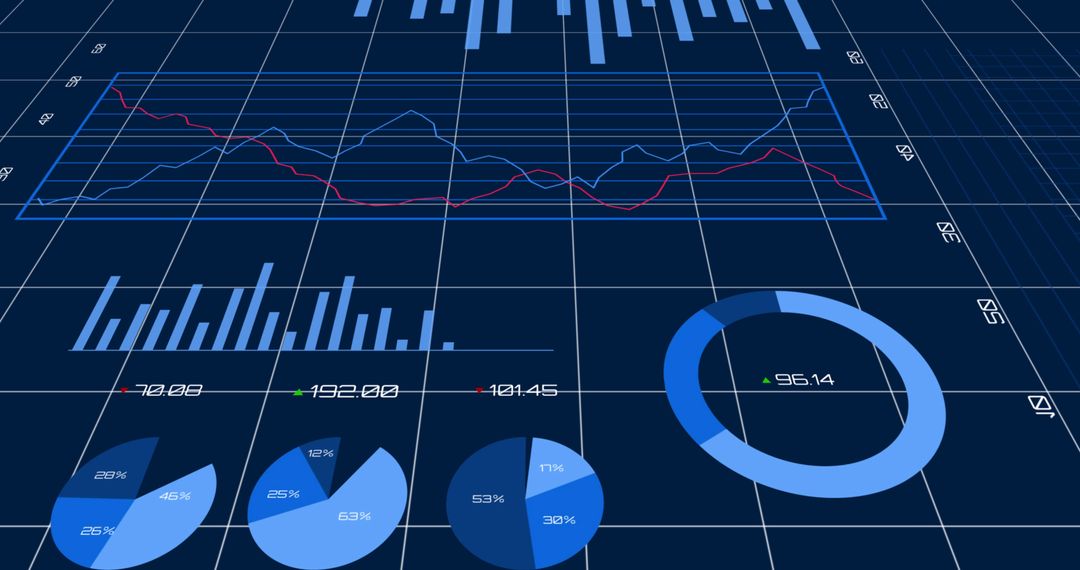
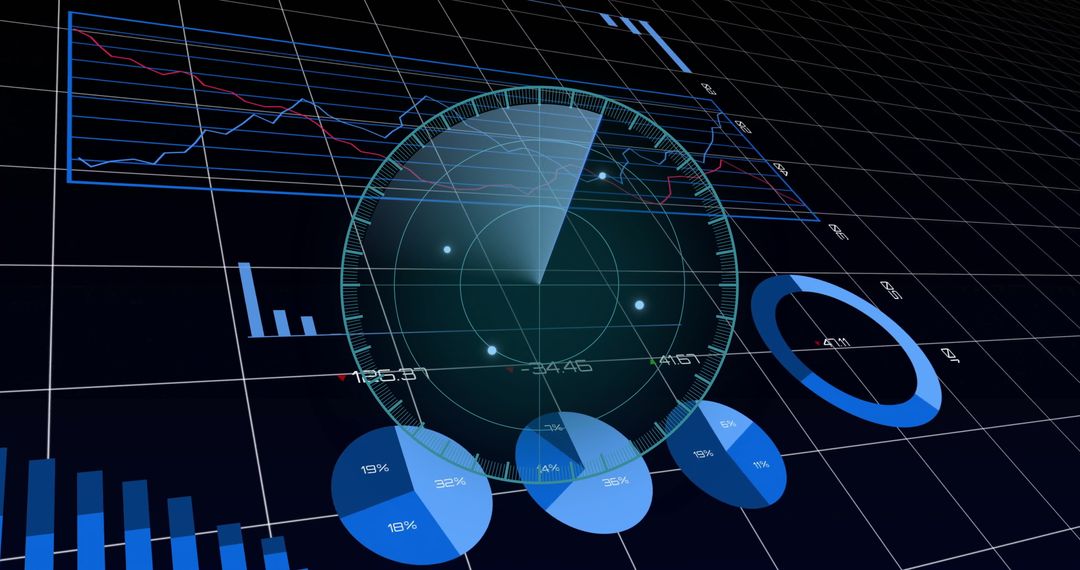
- Displaying Futuristic 3D Analytics Dashboard with Network Nodes, Donut Chart and Line Graphs
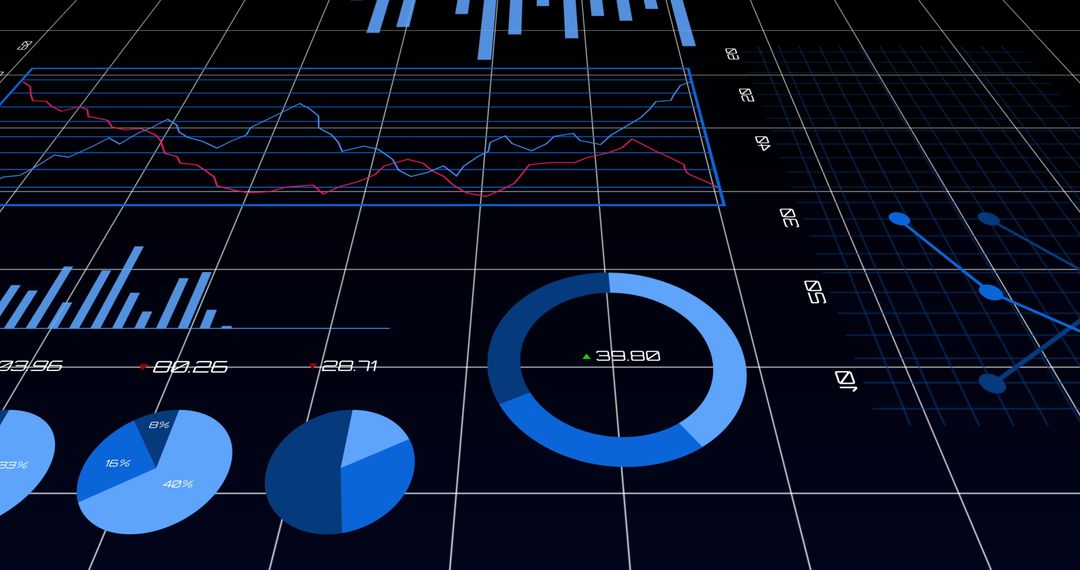
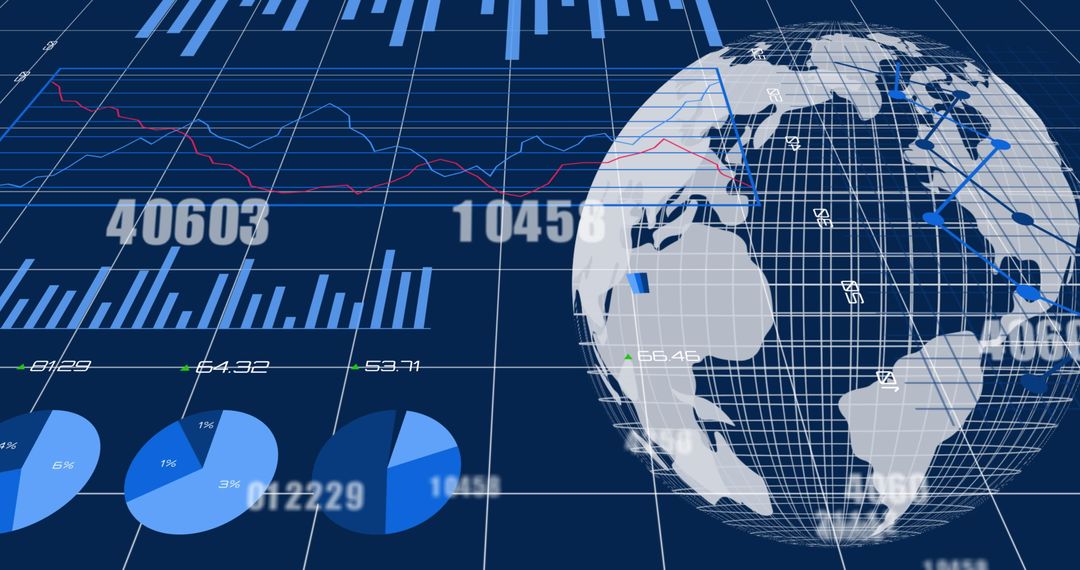
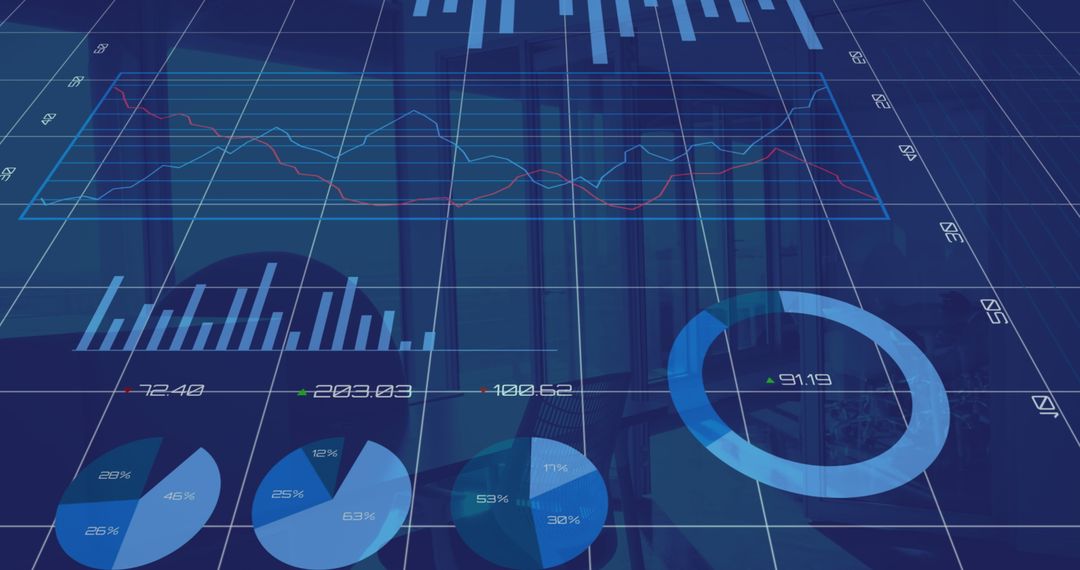
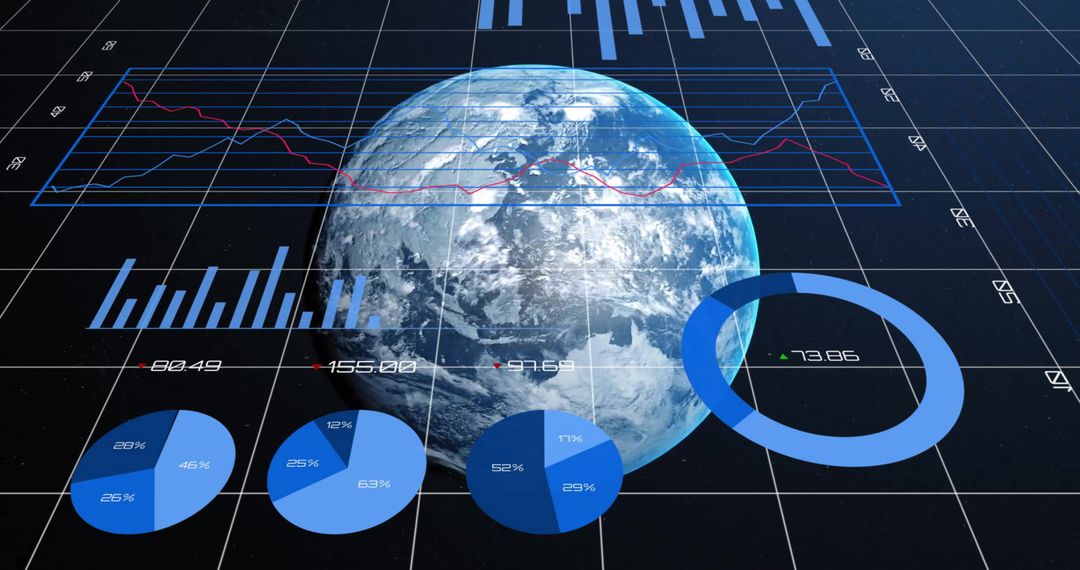
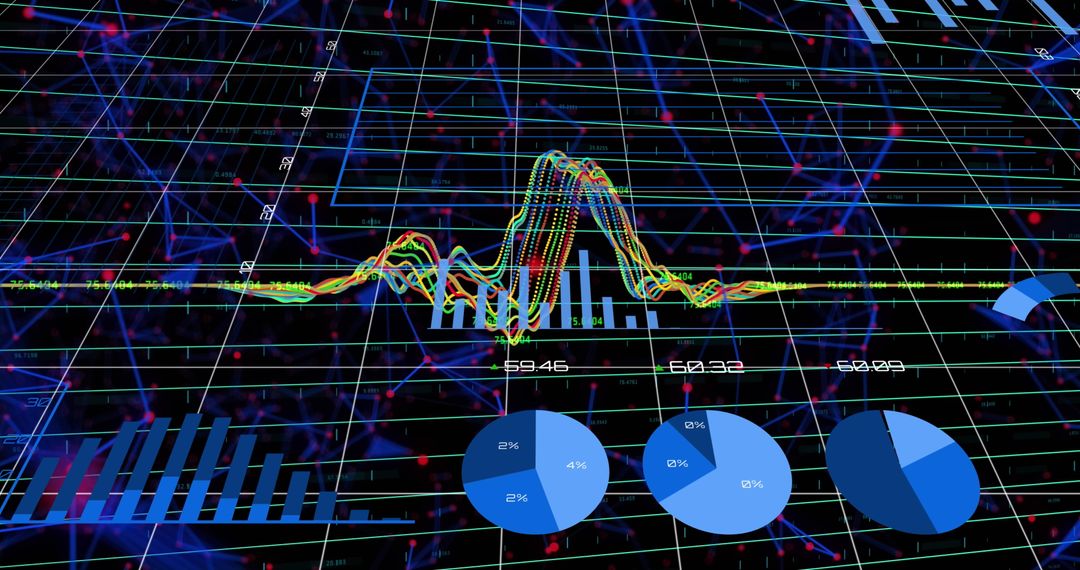
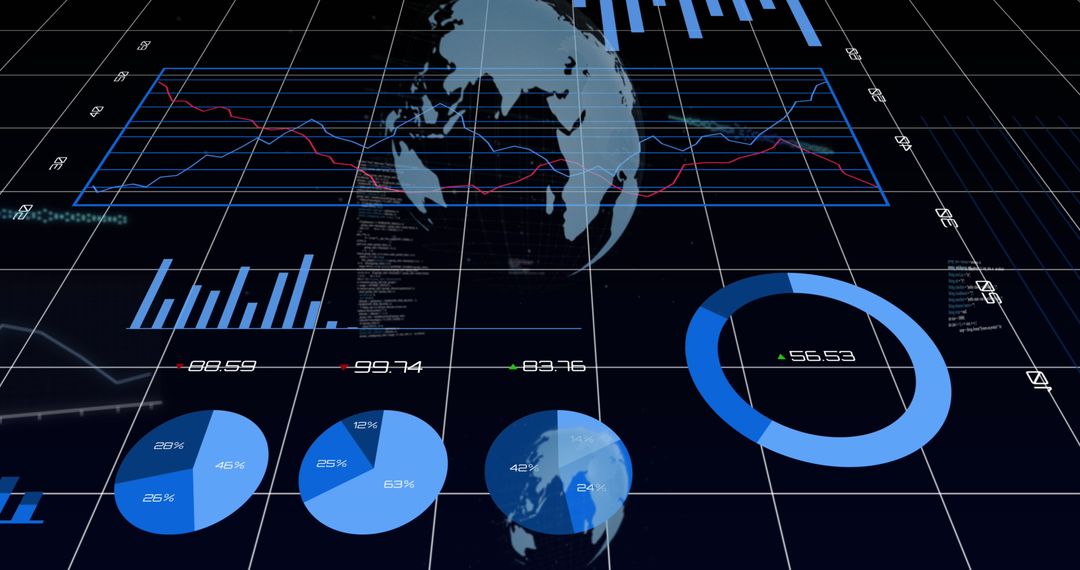
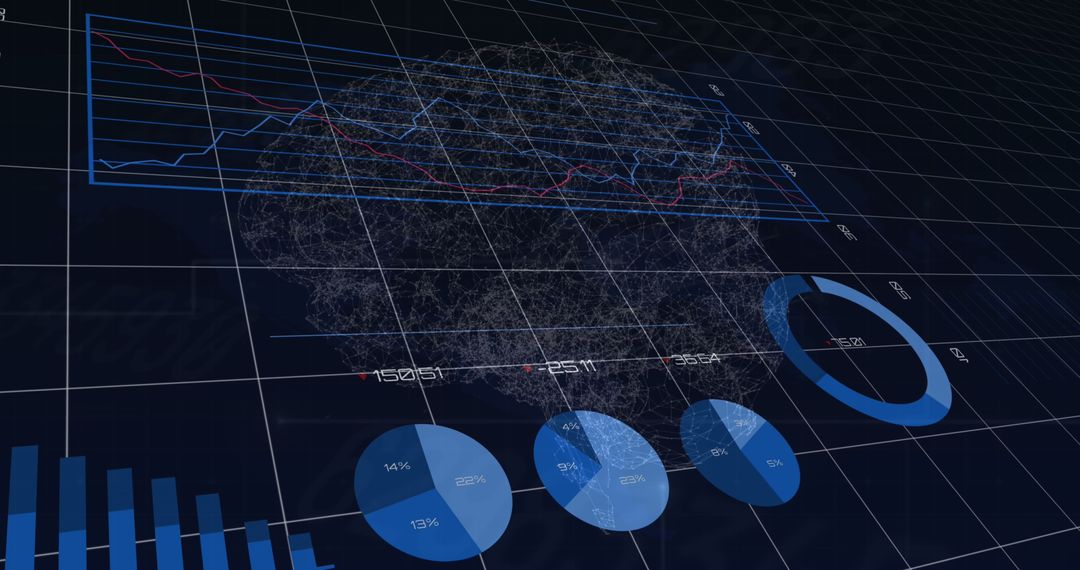
Displaying Futuristic 3D Analytics Dashboard with Network Nodes, Donut Chart and Line Graphs Image

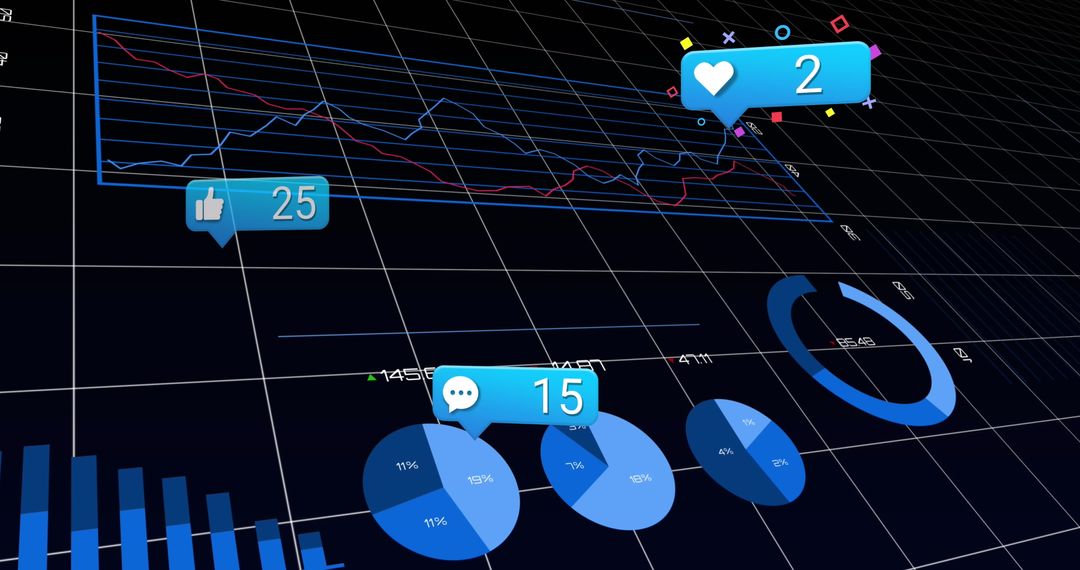
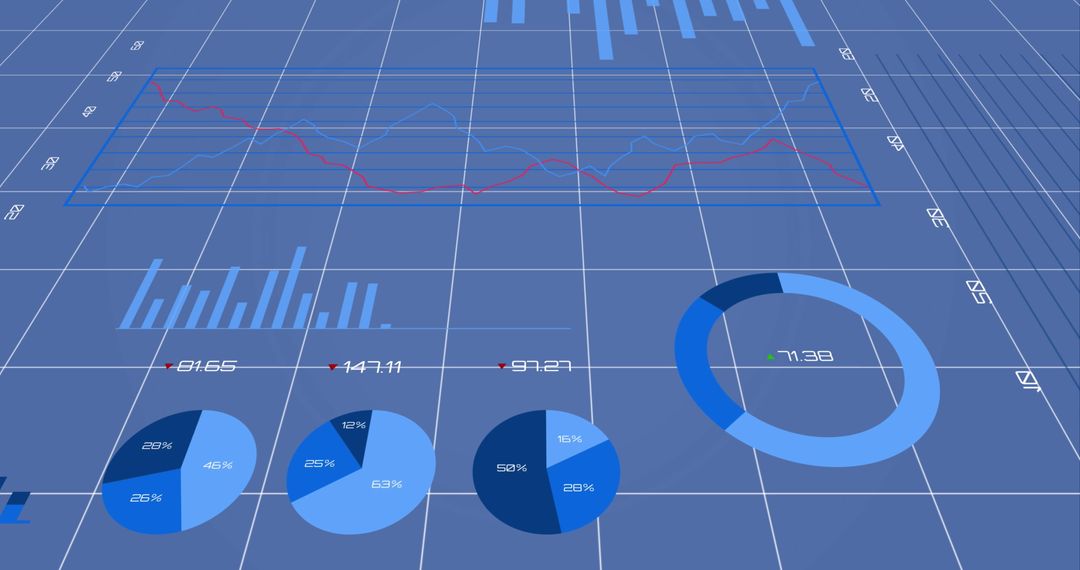
Displaying tilted 3D analytics dashboard with neon blue donut chart, multiple pie charts, bar chart and line graphs over gridded background. Featuring overlaid network of user icons and connecting lines suggesting user connections, social network analysis, customer segmentation. Offering high contrast dark theme with blue highlights for futuristic tech aesthetic. Ideal for use in presentations, website headers, blog posts, whitepapers, reports, marketing materials, pitch decks, and training modules. Suggesting use cases: illustrating data analytics, business intelligence, network analysis, big data visualization, financial monitoring, KPI tracking, UX research. Useful for technology startups, SaaS platforms, fintech brands, data science agencies, consulting firms. Allowing room for overlay text, numeric callouts, logo placement, and custom color grading. Suitable for hero banners, slide backgrounds, social media ads, print brochures, and editorial content.
Powered by 


0
downloads
downloads
Tags:
More
Credit Photo
If you would like to credit the Photo, here are some ways you can do so
Text Link
photo Link
<span class="text-link">
<span>
<a target="_blank" href=https://pikwizard.com/photo/displaying-futuristic-3d-analytics-dashboard-with-network-nodes-donut-chart-and-line-graphs/5825f1cb55763676af0a75bbb3a5bbdb/>PikWizard</a>
</span>
</span>
<span class="image-link">
<span
style="margin: 0 0 20px 0; display: inline-block; vertical-align: middle; width: 100%;"
>
<a
target="_blank"
href="https://pikwizard.com/photo/displaying-futuristic-3d-analytics-dashboard-with-network-nodes-donut-chart-and-line-graphs/5825f1cb55763676af0a75bbb3a5bbdb/"
style="text-decoration: none; font-size: 10px; margin: 0;"
>
<img src="https://pikwizard.com/pw/medium/5825f1cb55763676af0a75bbb3a5bbdb.jpg" style="margin: 0; width: 100%;" alt="" />
<p style="font-size: 12px; margin: 0;">PikWizard</p>
</a>
</span>
</span>
Free (free of charge)
Free for personal and commercial use.
Author: Creative Art
Similar Free Stock Images
Premium


Premium


Premium


Premium


Premium


Premium


Premium


Premium


Premium


Premium


Premium


Premium


Premium


Premium


Premium


Premium


Premium


Premium


Premium


Premium


Premium


Premium


Premium


Premium