- Home >
- Stock Photos >
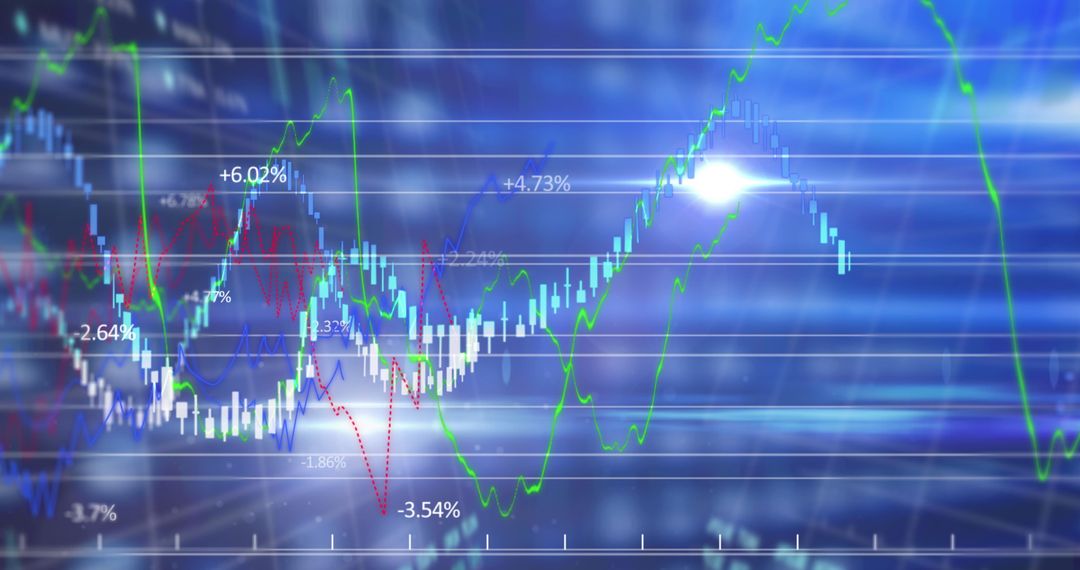
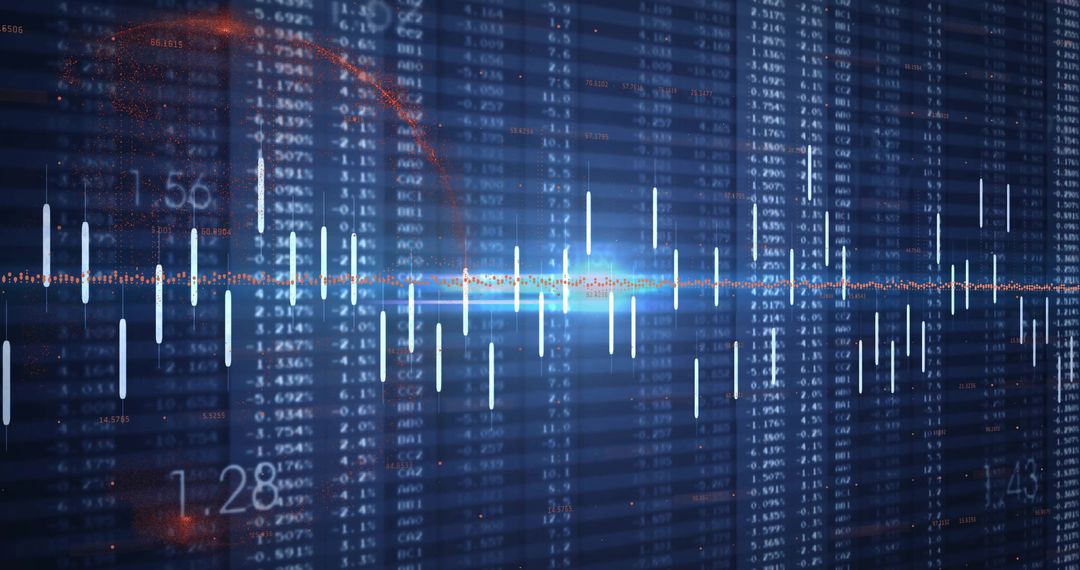
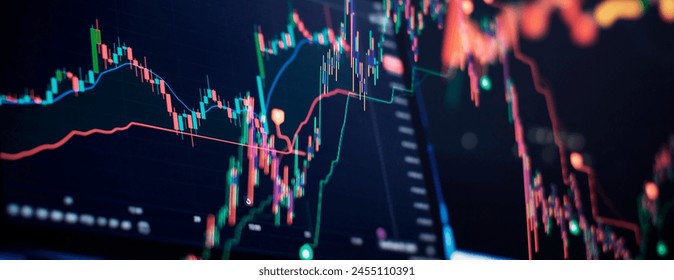
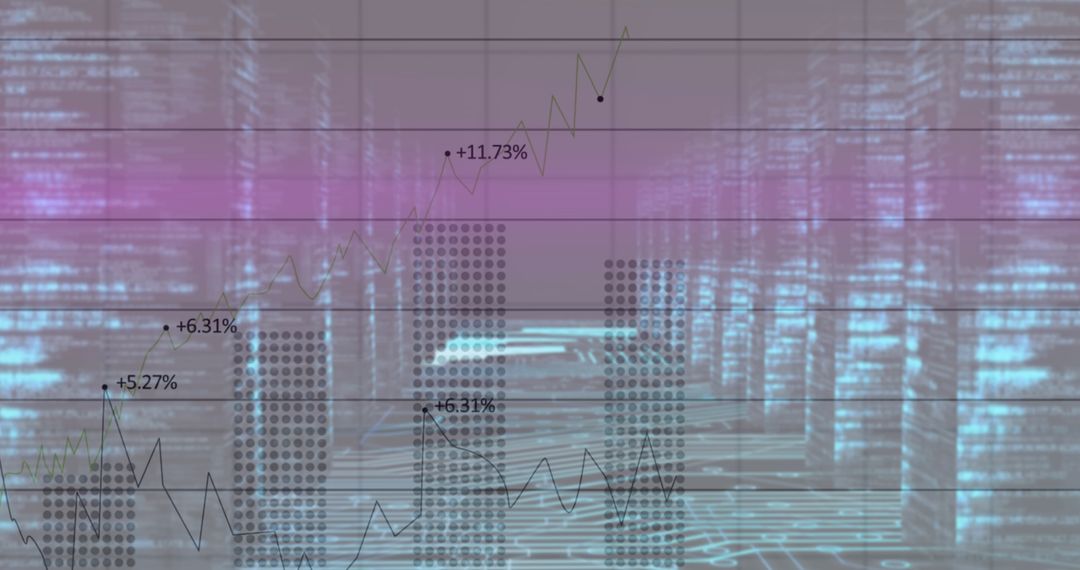
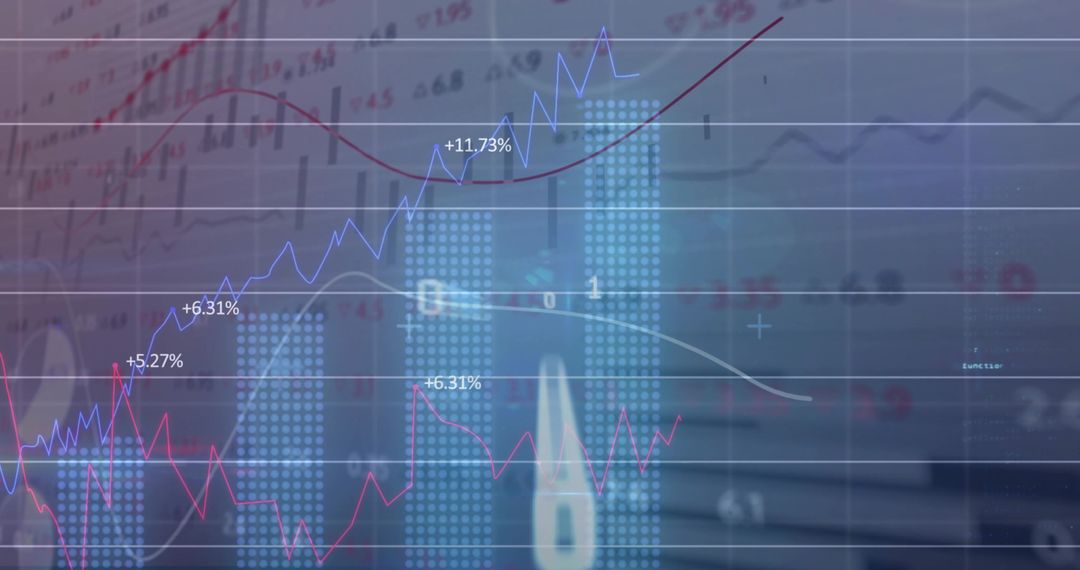
- Displaying Futuristic Blue Candlestick Trading Chart Showing Market Data, Neon Analytics
Displaying Futuristic Blue Candlestick Trading Chart Showing Market Data, Neon Analytics Image

Displaying candlestick price movement over numeric grid with glowing neon highlights, creating high-tech financial atmosphere. Ideal for fintech websites, investment reports, trading platform interfaces, market analysis blogs, and social media campaigns. Serving as header banner for finance dashboards, background for investor pitch decks, visual element for cryptocurrency and forex content. Featuring deep blue palette, sharp numeric columns, and light streaks that emphasize motion and data flow. Allowing easy overlay of headlines, logos, and charts for marketing, editorial, or educational use.
Powered by  - Get 15% off with code: PIKWIZARD15


0
downloads
downloads
Tags:
More
Credit Photo
If you would like to credit the Photo, here are some ways you can do so
Text Link
photo Link
<span class="text-link">
<span>
<a target="_blank" href=https://pikwizard.com/photo/displaying-futuristic-blue-candlestick-trading-chart-showing-market-data-neon-analytics/6fb6bf3e93fefc79c152cc67a20b3c97/>PikWizard</a>
</span>
</span>
<span class="image-link">
<span
style="margin: 0 0 20px 0; display: inline-block; vertical-align: middle; width: 100%;"
>
<a
target="_blank"
href="https://pikwizard.com/photo/displaying-futuristic-blue-candlestick-trading-chart-showing-market-data-neon-analytics/6fb6bf3e93fefc79c152cc67a20b3c97/"
style="text-decoration: none; font-size: 10px; margin: 0;"
>
<img src="https://pikwizard.com/pw/medium/6fb6bf3e93fefc79c152cc67a20b3c97.jpg" style="margin: 0; width: 100%;" alt="" />
<p style="font-size: 12px; margin: 0;">PikWizard</p>
</a>
</span>
</span>
Free (free of charge)
Free for personal and commercial use.
Author: People Creations
Similar Free Stock Images
Premium


Premium


Premium


Premium


Premium


Premium


Premium


Premium


Premium


Premium


Premium


Premium


Premium


Premium


Premium


Premium


Premium


Premium


Premium


Premium


Premium


Premium


Premium


Premium