
- Home >
- Stock Photos >
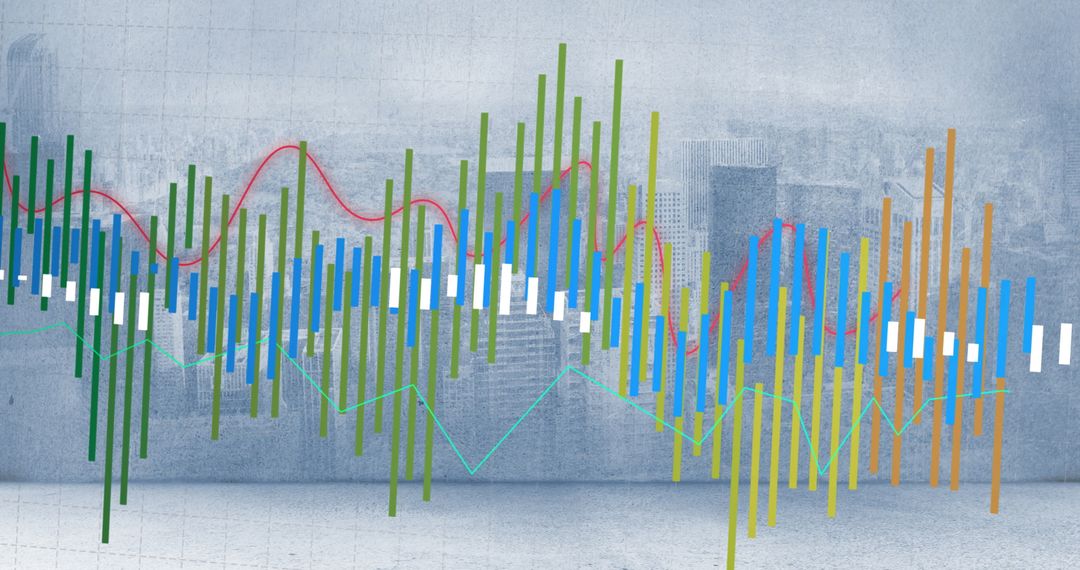
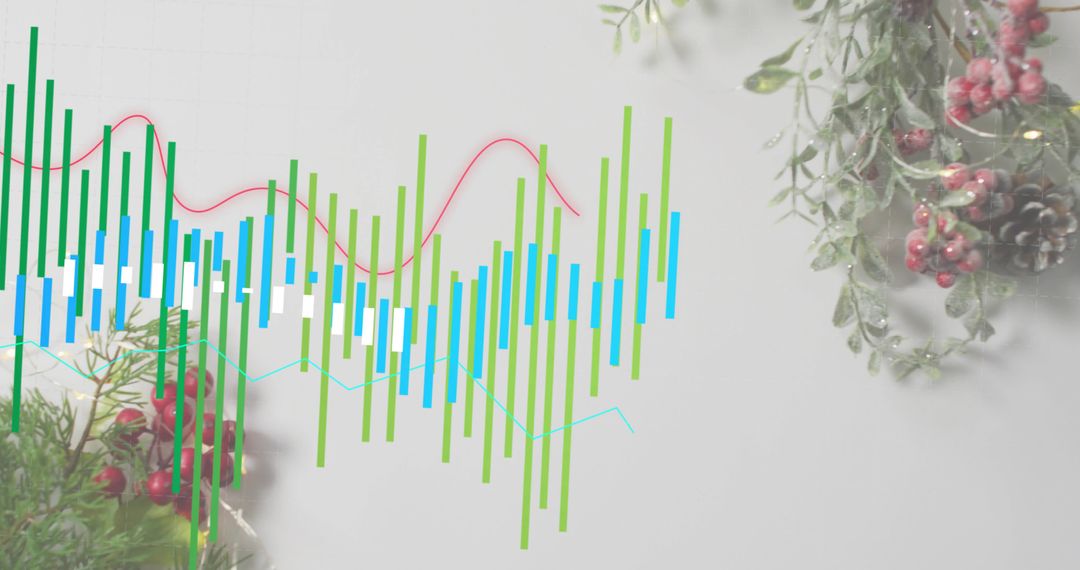
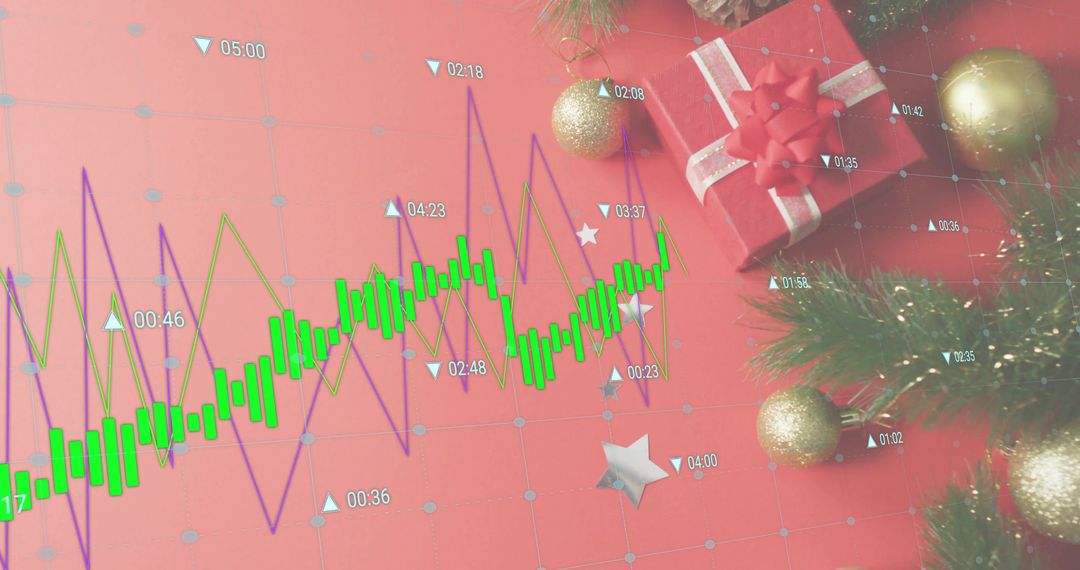
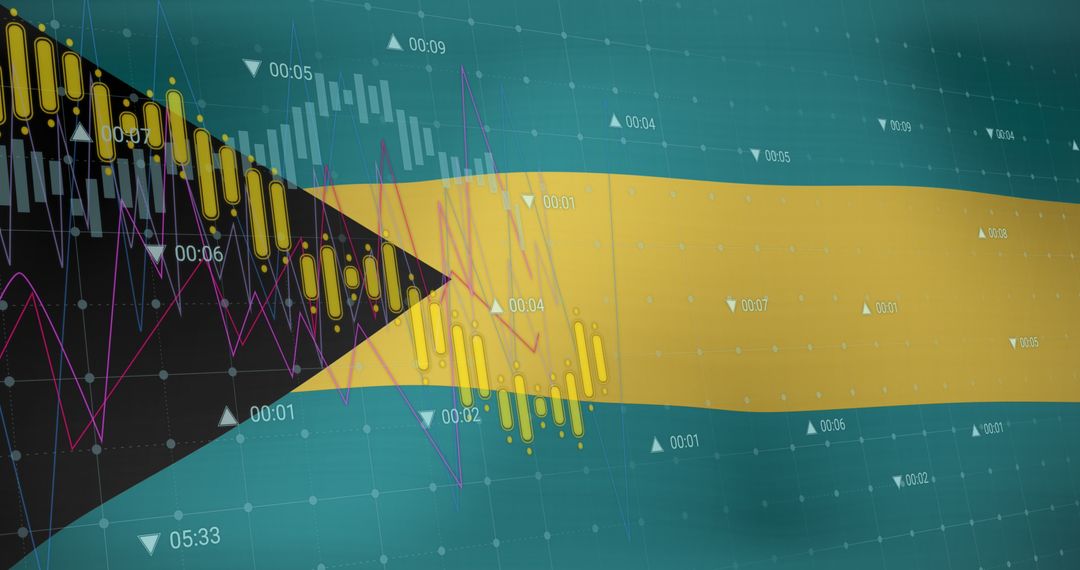
- Displaying green candlestick chart and purple line graph on white grid with gold baubles and pencil
Displaying green candlestick chart and purple line graph on white grid with gold baubles and pencil Image
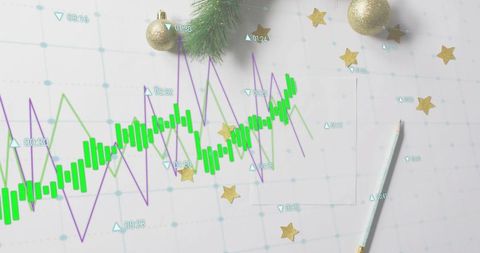
Showing green candlestick chart with purple line graph overlaid on white grid paper. Gold baubles, glitter stars, pencil, pine branch adding festive holiday mood to market data composition. Data markers and timestamps creating tech-forward trading atmosphere. Providing versatile visual for holiday finance themes, year-end market reports, investment newsletters, fintech website banners, social media posts promoting seasonal trading or market analysis, and business presentation slides. Leaving negative space for headline text, logo, call-to-action, or custom data overlays. Featuring crisp flatlay angle, high-contrast chart colors, and decorative accents for blending professional finance messaging with seasonal cheer.
Powered by 


0
downloads
downloads
Tags:
More
Credit Photo
If you would like to credit the Photo, here are some ways you can do so
Text Link
photo Link
<span class="text-link">
<span>
<a target="_blank" href=https://pikwizard.com/photo/displaying-green-candlestick-chart-and-purple-line-graph-on-white-grid-with-gold-baubles-and-pencil/1027ae95221a11b715e47c50f352532e/>PikWizard</a>
</span>
</span>
<span class="image-link">
<span
style="margin: 0 0 20px 0; display: inline-block; vertical-align: middle; width: 100%;"
>
<a
target="_blank"
href="https://pikwizard.com/photo/displaying-green-candlestick-chart-and-purple-line-graph-on-white-grid-with-gold-baubles-and-pencil/1027ae95221a11b715e47c50f352532e/"
style="text-decoration: none; font-size: 10px; margin: 0;"
>
<img src="https://pikwizard.com/pw/medium/1027ae95221a11b715e47c50f352532e.jpg" style="margin: 0; width: 100%;" alt="" />
<p style="font-size: 12px; margin: 0;">PikWizard</p>
</a>
</span>
</span>
Free (free of charge)
Free for personal and commercial use.
Author: Awesome Content
Similar Free Stock Images

Premium


Premium


Premium


Premium


Premium


Premium


Premium


Premium


Premium


Premium


Premium


Premium


Premium


Premium


Premium


Premium


Premium


Premium


Premium


Premium


Premium


Premium


Premium


Premium

